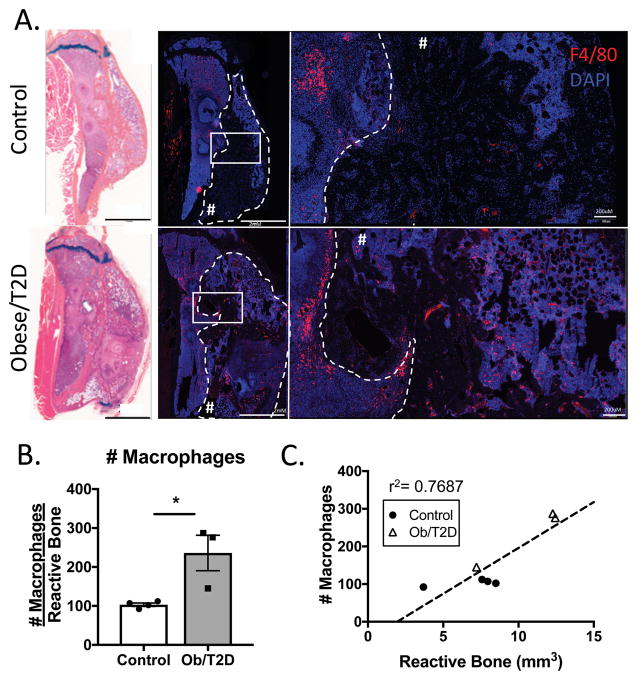
Figure 6. Increased F4/80+ macrophages in infected tibiae of obese/T2D mice.
Mice were harvested at day 35 post placement of infected implant. Histological sections were immunostained for F4/80 to visualize macrophages. A. Representative images demonstrating increased macrophages in the marrow space and periosteal reactive bone of obese/T2D mice. Paired Alcian blue hematoxylin stained sections reveal the region of interest. Periosteal reactive bone is outlined with dashed lines and denoted with #. B. Quantitation of F4/80+ cells in the ROI (Inside dashed lines in A.). C. Linear regression analysis demonstrating the correlation between number of macrophages within the periosteal reactive bone ROI and the volume of reactive bone within the ROI. Scale bar length is 2mm. * p<.05 unpaired t test. n ≥ 3. Each point represents one mouse.

