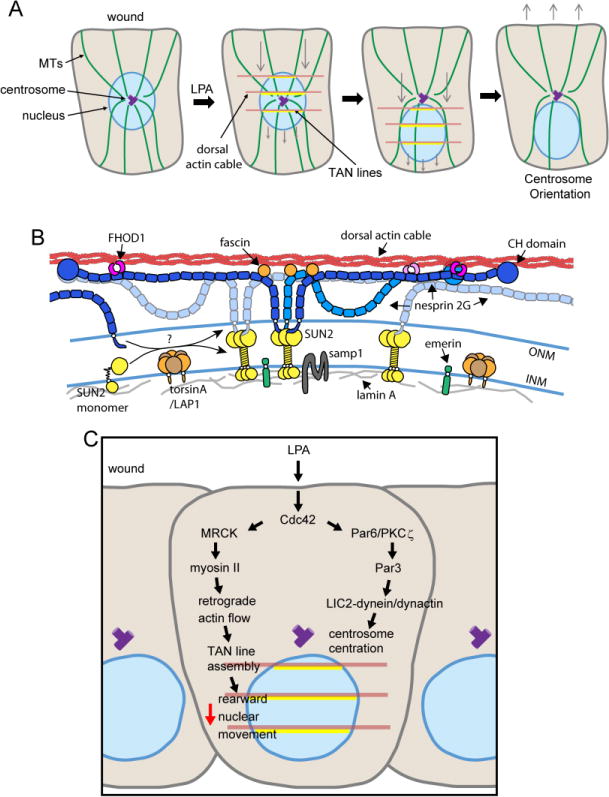
Figure 1. Nuclear translocation by TAN lines during fibroblast polarization.

A. Model for rearward translocation of the nucleus following LPA stimulation of wound edge fibroblasts. LPA induces formation and rearward flow of dorsal actin cables (brown) that couple to the nucleus through TAN lines (yellow). Combined with centrosome centration (see panel C), nuclear translocation results in anterior orientation of the centrosome. Purple rectangles are the centrosome. Blue circle is the nucleus. Gray arrows indicate the direction of actin flow and nuclear translocation in the second and third panels and the polarity of the cell and direction of migration if the cell is stimulated in the fourth panel. Adapted from reference [83]. B. Molecular model for TAN lines. A dorsal actin cable (red) is linked to the nucleus through multiple nesprin-2G (blue) and SUN2 (yellow, shown as trimer) LINC complexes anchored by lamin A (grey). TAN line associated proteins, FHOD1 (magenta) and fascin (orange), are only depicted on the central nesprin-2G for clarity. Both are required for TAN line formation. Samp1 (dark grey) and emerin (green) contribute to TAN line anchoring. TorsinA (brown/orange) is depicted as a regulator of LINC complex formation and may also regulate TAN line assembly (see text). Adapted from reference [84]. C. Schematic of the two Cdc42 pathways activated by LPA that contribute to centrosome orientation. One is nuclear translocation mediated by dorsal actin cable (brown) flow and TAN lines (yellow); the other, centrosome centration mediated by MT anchoring at cortical sites by dynein/dynactin and Par3. Red arrow indicates the direction of nuclear translocation.
