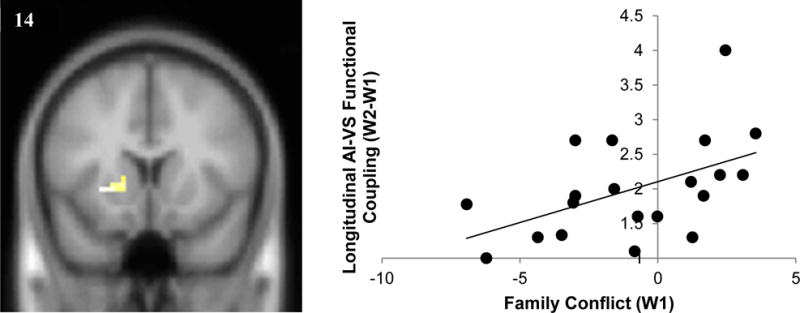
Figure 1.

Higher levels of family conflict at W1 were associated with relative increases in VS-AI coupling across time (xyz=−27, 14, −2; k = 27, t = 3.59, p < .005). For descriptive purposes parameter estimates were extracted from the VS which showed functional coupling with the AI and plotted with W1 family conflict. Note. A greater number on the y axis indicates relatively greater coupling between the VS and AI at W2 compared to W1 (W2-W1), highlighting increases in connectivity over time. The x axis represents mean scores on self-reported family conflict. VS cluster reflects a threshold of p<.005, k > 20.
