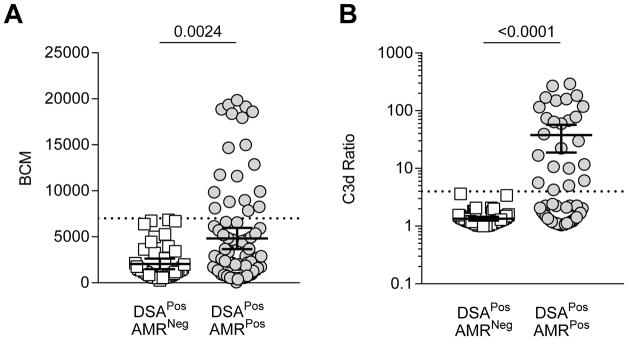
Figure 2. Comparison of BCM and C3d ratio for each DSA bead for each DSA+ patient between DSAPosAMRPos and DSAPosAMRNeg patients.
(A) Each dot represents BCM value for a single bead. Only DSA beads with BCM>500 are represented. Beads of DSAPosAMRPos patients (n= 85) have significantly higher BCM than DSAPosAMRNeg patients (n=45) (mean±SD respectively 4814±5407 vs. 2060±1908, p=0.0024 Mann-Whitney). Only beads from DSAPosAMRPos patients had a BCM >7000 (dashed line). (B) Each dot represents the C3d ratio value for a single bead. Only DSA beads with a C3d ratio >1 are represented. Beads of DSAPosAMRPos patients (n=81) have significantly higher C3d ratios than beads of DSAPosAMRNeg patients (n=49) (mean±SD respectively 21.84±49.88 vs. 1.5±0.48, p<0.001 Mann-Whitney). Only beads from DSAPosAMRPos patients had a C3d ratio >4 (dashed line). Data graphed as mean ± CI 95.

