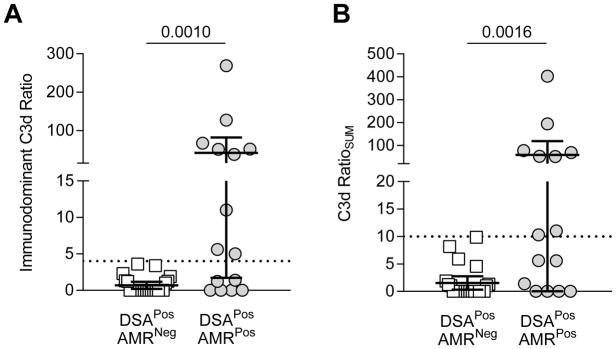
Figure 4. Use of Immunodominant C3d MFI and C3d ratioSUM Values to Predict AMR Diagnosis.
(A) The immunodominant C3d value was graphed for each patient; each symbol is the value of a single immunodominant DSA for a given patient. DSAPosAMRPos patients had significantly higher immunodominant C3d ratios than DSAPosAMRNeg patients (mean±SD: 41.9 ±72.5 vs. 0.7±1.1, p= 0.0010). Immunodominant C3d ratio >4 (indicated by a dashed line) was only found in DSAPosAMRPos. (B) The C3d RatioSUM was calculated for each patient in each group; each symbol represents the sum total of C3d activation for the given patient. DSAPosAMRPos patients had significantly higher C3d RatioSUM (mean±SD: 58.7±108.3 vs. 1.5±2.8, p= 0.0016). C3d RatioSUM >10 (indicated by a dashed line) was only found in DSAPosAMRPos. DSAPosAMRNeg patients, white squares, n=23; DSAPosAMRPos patients, gray circles, n=15. Mann-Whitney analysis was performed, p values as depicted in each graph.

