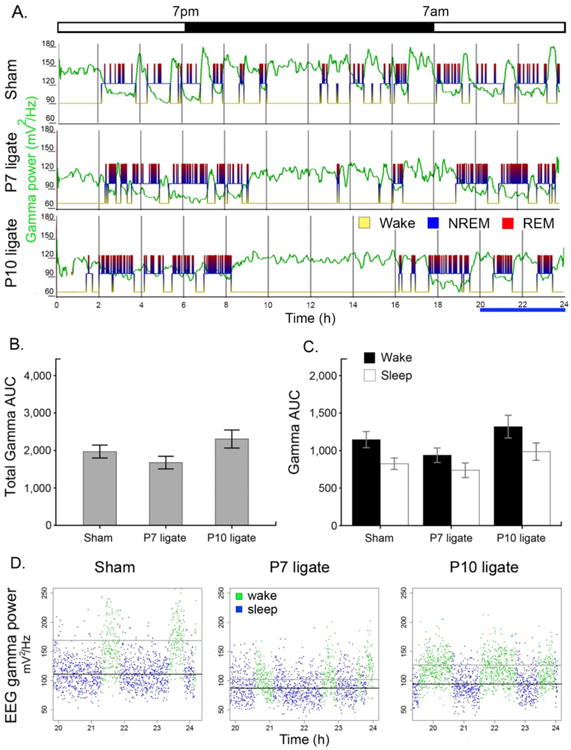
Figure 4.

Gamma power analyses was not statistically significant unlike delta power. A. Representative traces of gamma power along with sleep hypnogram for each group. B. Total gamma AUC of ligates were significantly different from each other (p=0.053), but not from sham (One-way ANOVA, Bonferroni correction; F=3.347, p=0.047, n= 18, 10, 10 for sham, P7, P10 ligates respectively). C. Gamma AUC by wake/sleep cycle was not significant by 2-way ANOVA across treatment groups (paired t-test within each group showed p values, p=0.0003, p=0.067, p=0.026 and n=18, 10, 9 for sham, P7, and P10 respectively). D. Scatter plot of EEG gamma power in duration of 4h for each group. (black line: mean for sleep; gray line: mean for wake).
