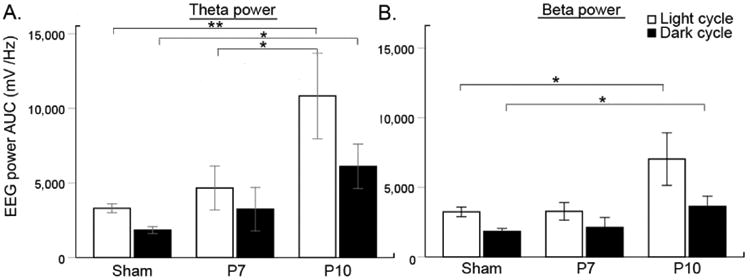
Figure 5.

Theta beta power analyses A. Significant increase in theta power was detected during the light and dark cycle in the P10 mice compare to controls (One-way ANOVA; F=6.45, p=0.004 and F=4.99, p=0.012 for theta light and dark, n=18, 10, 11 for sham, P7, and P10 respectively. P10 mice had significantly higher theta light and dark compared to sham and theta light compared to P7 ligate mice during the light cycle (Bonferroni correction for P10: p=0.004 and p=0.01 vs. sham theta light and dark respectively; and p=0.048 vs. P7 theta dark). B. Beta power showed similar trends in P10 mice compared to control mice but not to P7 (One-way ANOVA; F=4.40, p=0.020 and F=3.50, p=0.041 for beta light and dark, same number of n as in theta analysis; Bonferroni correction for P10: p=0.027 and p=0.043 vs. sham beta light and dark respectively).
