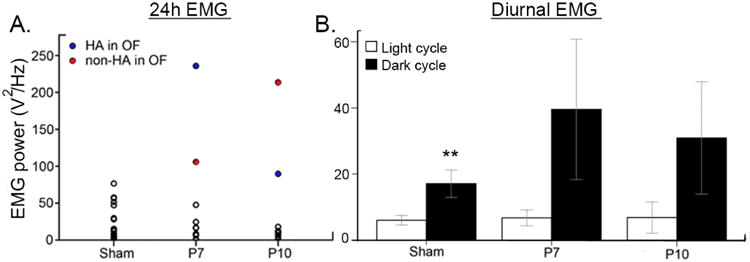
Figure 6.

24h EMG lead power analyses. A. Total EMG power during 24h EEG recording identified hyperactive mice in the ligate groups. B. Significant diurnal variation in EMG activity detected in control mice was lost in both ligate groups due to the variability in hyperactivity (paired t-test p=0.003, 0.123, 0.101 and n=19, 10, 10 for sham, P7, and P10 respectively).
