. 2018 May 31;25(2):123–132. doi: 10.11005/jbm.2018.25.2.123

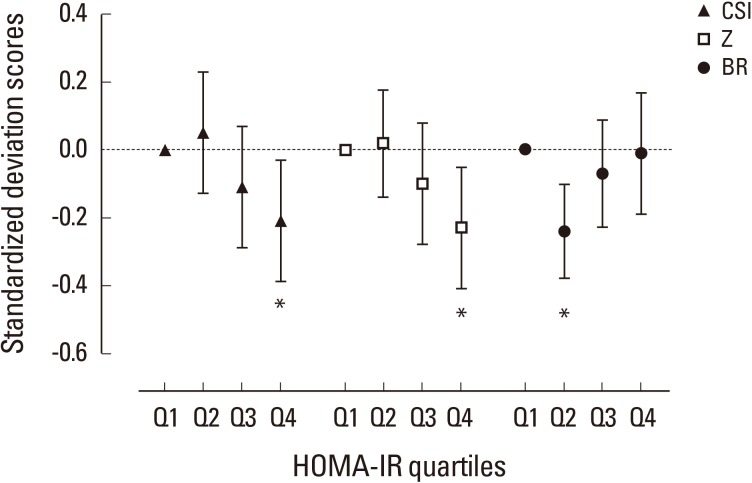
Fig. 3. Standardized difference (in standard deviation [SD] units±95% confidence interval) in quantitative computed tomography-derived bone geometry parameters at femur according to homeostasis model assessment of insulin resistance (HOMA-IR) quartiles. Dashed line indicates the mean value of the subjects in lowest quartile after adjustment for age, weight, and height. The mean difference between the groups were expressed in SD scores as divided by the SD of the lowest quartile group. Asterisk (*) indicated P<0.05 as compared with the lowest quartile as reference group. Q, quartile; CSI, compressive strength index; Z, section modulus; BR, buckling ratio.

Fig. 3