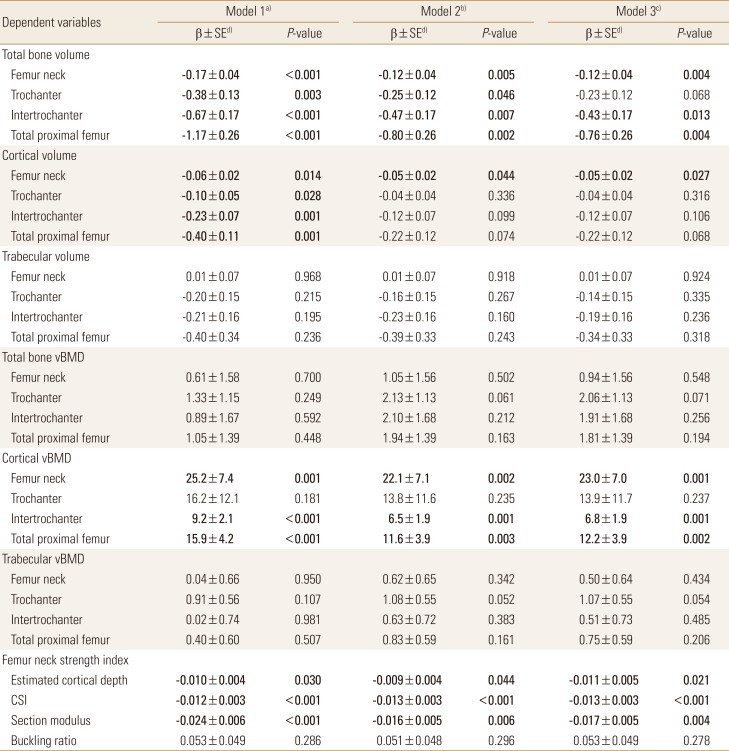
Table 2. Association of homeostasis model assessment of insulin resistance with bone geometry parameters.
Bold characters indicate significant P-values.
a)Model 1: adjusted for age, height, and weight. b)Model 2: adjusted for age, height, waist, thigh circumference. c)Model 3: adjusted for age, height, weight, current smoking, alcohol intake, physical activity, 25-hydroxyvitamin D, and log-transformed high-sensitivity C-reactive protein. d)Standardized β coefficients.
vBMD, volumetric bone mineral density; CSI, compressive strength index.

