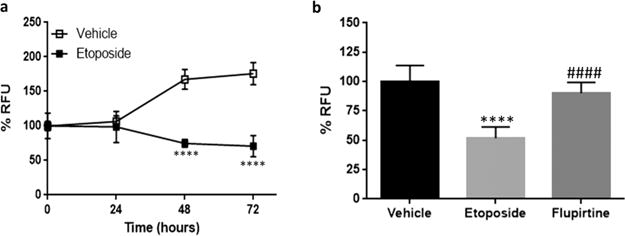
Figure 5.

Optimization and validation of etoposide-induced cell death in PC12 cells (passage 9–13). 50 × 103 cells/well. (a) Approximately 50% cell death was observed after 48 h. Four replicates per experiment. Values are represented as mean ± SD. Multiple t test, Holm-Sidak method, alpha = 5.000%, ****p < 0.0001. (b) Fluorescence measured after 48 h. Flupirtine at 3 μM concentration rescued the cells from apoptosis. Experiment repeated thrice. Values are represented as mean ± SD. Unpaired two-tailed t test, 95% CI, ****p < 0.0001 in comparison to vehicle. ####p < 0.0001 in comparison to etoposide treatment.
