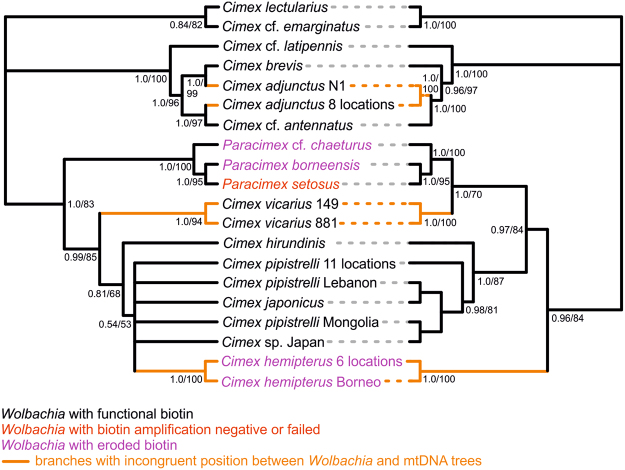
Figure 1.
Cladograms based on mtDNA (right) and Wolbachia WSP and HCPA loci (left). Bayes posterior probability values are given at each node. For congruence test resuls see Table 1. All unique combinations of sequences of Wolbachia were used, along with mtDNA of corresponding samples. Labels after species name refer to collection site (Table S1). Highlighted are the different positions of a) Cimex adjunctus sample N1, b) C. vicarius and c) C. hemipterus.

