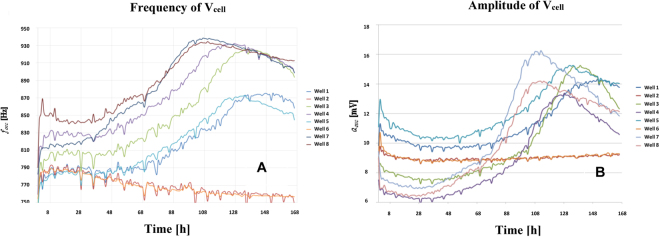
Figure 8.
Measured time evolution of the oscillation frequency (A) and amplitude (B) of the voltage signal Vcell. The curves correspond to 2500 cells (W1, W3), 5000 cells (W4, W5) and 10000 cells (W7, W8), seeded at t = 0 into separate well pairs. Wells W2 and W6 contain only medium. Dips in Fig. 8 are due to noise influence. Signals (currents and voltages) on electrodes and cells must be small enough to avoid damage in cells and preserve the linear model for the electrode-solution. These facts increase the sensitivity of measurements to noise sources and, decreases the Signal-to-Noise Ratio (SNR) in measurements.

