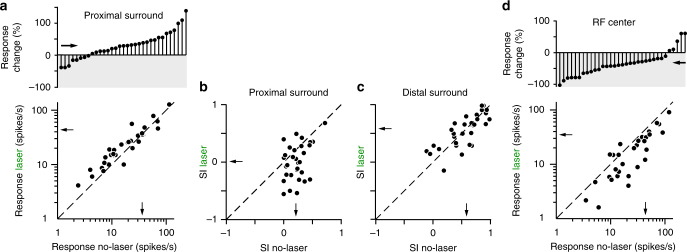
Fig. 3.
V2 feedback controls response amplitude in the sRF and proximal surround. a, b Changes in proximal surround-suppression with V2 feedback inactivated. a Bottom: response with and without laser for stimuli involving the sRF and proximal surround (i.e., stimulus size corresponding to the peak of the laser-on curve). Top: Cell-by-cell percent response change caused by laser stimulation, for stimuli involving the sRF and proximal surround. Downward and upward stem: decreased and increased response, respectively. b Suppression Index (SI; see Methods) with and without laser for stimuli extending into the proximal surround. SI = 1 indicates maximal suppression, SI = 0 indicates no suppression, and negative SI values indicate facilitation. c Same as b but for stimuli extending into the distal surround (largest stimulus used). d Bottom: response with and without laser for stimuli matched in size to the sRF diameter (i.e., the stimulus diameter at the peak of the empirically measured, spatial-summation curve in the no-laser condition). Top: Cell-by-cell percent response change caused by laser stimulation for stimuli matched to the sRF diameter. Arrows: means. One data point with very high firing rate in the scatterplots of panels a–d was removed for visualization purpose, but it was included in the analysis. Dashed line in a–d: unity line

