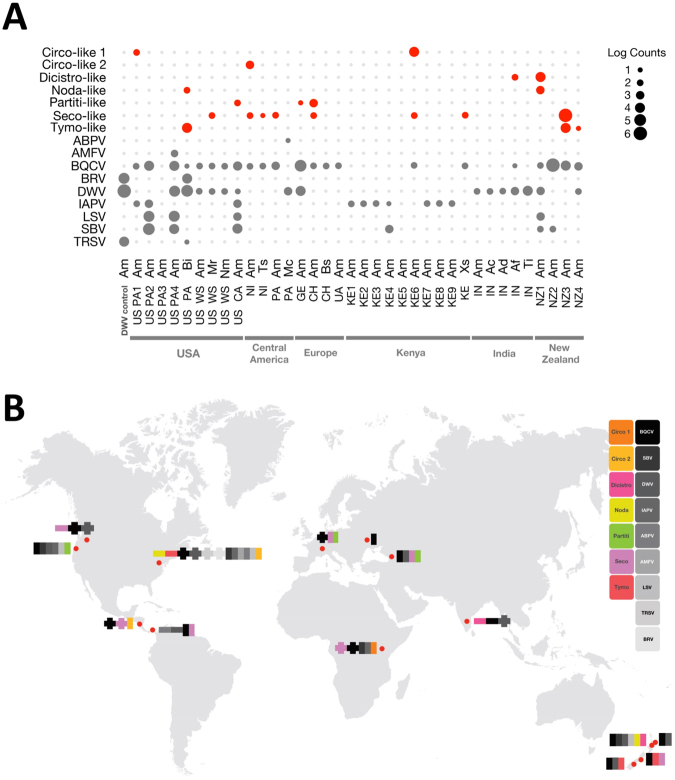
Figure 1.
Summary of known and newly identified viral contigs from all samples. These figures summarize the distributions of the known viruses and newly identified viruses (with RdRp sequences and present at >0.1% of the reads in a given sample) from this study. (A) Plot showing the prevalence of all known bee viruses (in grey), as well as the 7 novel viruses detected in this dataset that contain an RdRp or other replicase protein (in red) in log read counts. Individual samples are listed according to location, with each sample name containing the location (two letter code for country or, for US samples, state) followed by a two letter code for the species. See Table 1 for complete information on location and species for each sample. (B) This map shows the distribution of known viruses (colored in greyscale) and newly identified viruses (colored) in A. mellifera samples (vertical bars) and non-A. mellifera samples (horizontal bars) collected at each site. Where a virus was identified in both sample types, the horizontal and vertical bars are overlapping.

