Fig. 2.

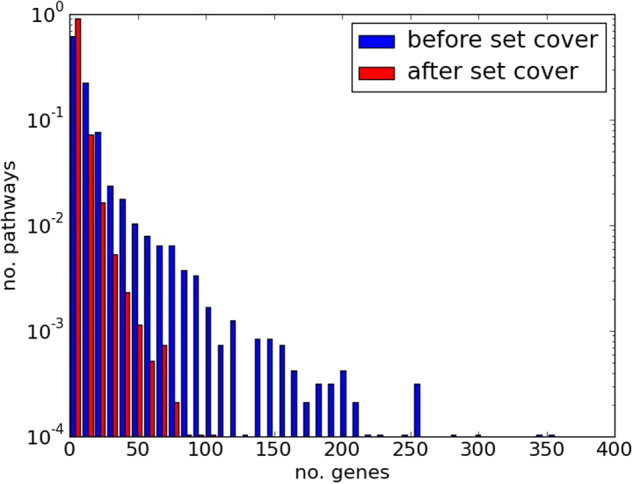
Genes in multiple pathways before and after applying the set cover algorithm. Histogram showing the proportion of the genes in the data set that appear in multiple pathways (indicating redundancy), before and after set cover

Genes in multiple pathways before and after applying the set cover algorithm. Histogram showing the proportion of the genes in the data set that appear in multiple pathways (indicating redundancy), before and after set cover