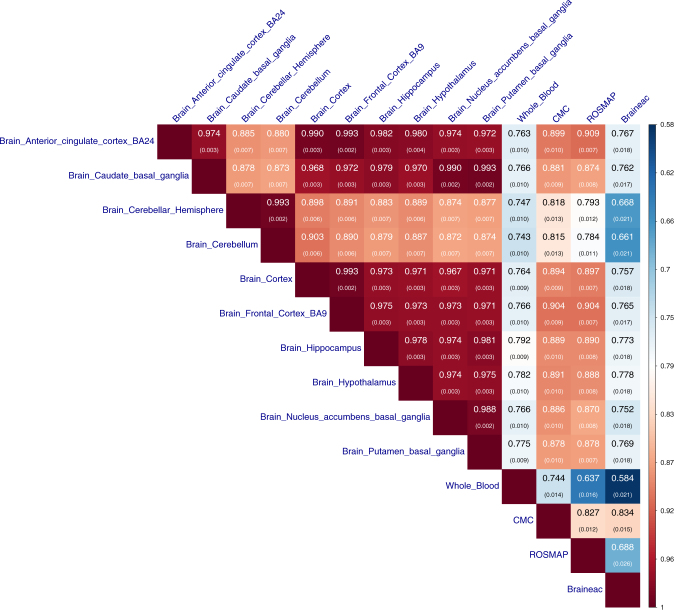
Fig. 1.
Estimated correlation of genetic effects of cis-eQTLs between tissues. We estimated rb between brain regions, between brain and blood tissues, and between data sets. The top-associated cis-eQTLs (one for each gene) were selected from GTEx-muscle at PeQTL < 5 × 10⁻⁸. Shown in each cell is the estimate of rb with its standard error given in the parentheses (Methods). In the Braineac data, the eQTLs effect sizes were estimated from gene expression levels averaged across 10 brain regions

