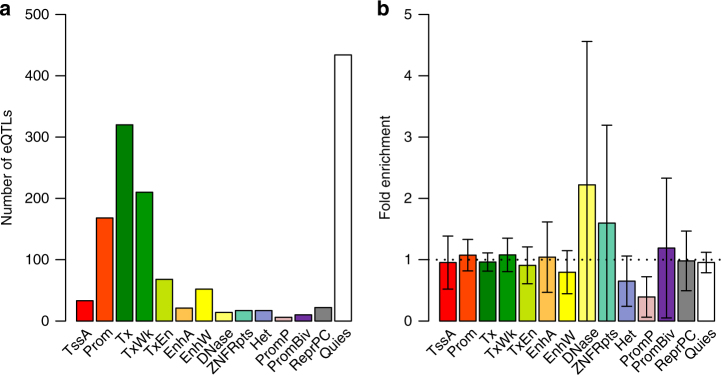
Fig. 2.
Enrichment of tissue-specific cis-eQTLs in functional annotations. a The distribution of cis-eQTLs across 14 functional categories derived from RMEC (Methods). b Estimated enrichment of TD (testing for the difference in cis-eQTL effect between CMC-brain and GTEx-blood) in each functional category (Methods). Error bars represent 95% confidence intervals around the estimates. The black dash line represents fold enrichment of 1. Different colors in a and b correspond to 14 functional categories: TssA: active transcription start site, Prom: upstream/downstream TSS promoter, Tx: actively transcribed state, TxWk: weak transcription, TxEn: transcribed and regulatory Prom/Enh, EnhA: active enhancer, EnhW: weak enhancer, DNase: primary DNase, ZNF/Rpts: state associated with zinc finger protein genes, Het: constitutive heterochromatin, PromP: poised promoter, PromBiv: bivalent regulatory states, ReprPC: repressed Polycomb states, and Quies: a quiescent state

