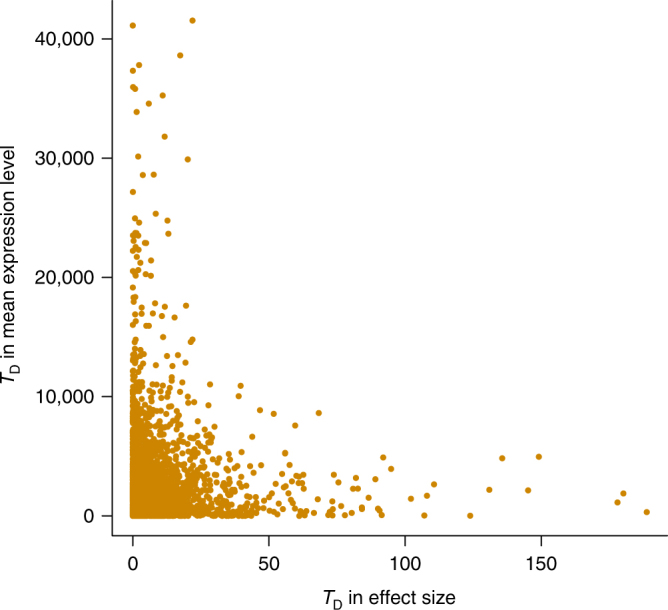
Fig. 3.

Correlation of difference in cis-eQTL effect and difference in expression level. Each dot represents one of the 3569 genes between GTEx-cerebellum and GTEx-blood. The 3569 genes were ascertained with at least one cis-eQTL with PeQTL < 5 × 10⁻⁸ in GTEx-muscle and expressed in GTEx-cerebellum and GTEx-blood (i.e. genes which have at least 10 samples with RPKM >0.1 and raw read counts >6). In this analysis, we used cis-eQTL effects in SD units and gene expression levels in log2(RPKM) units to avoid confounding of the correlation by the mean–variance relationship in gene expression
