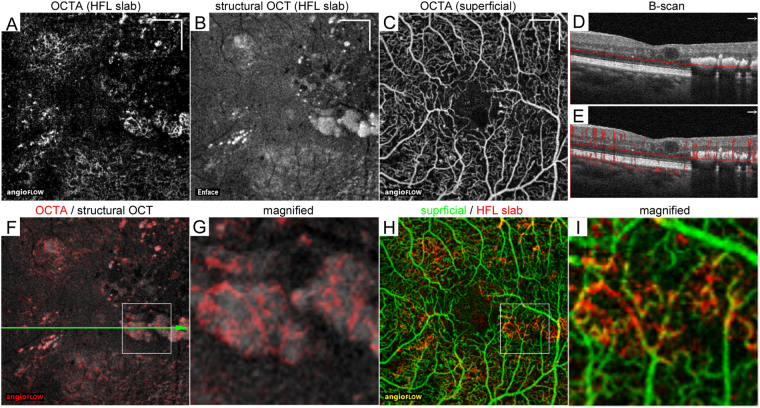
Figure 4.
Projection artifacts in confluent hyperreflective foci within the HFL in a 60-year-old patient with moderate NPDR. The 10-μm-thick en-face OCTA (A) and structural OCT (B) images in the HFL between the red lines in panel D. (C) OCTA image in the superficial layer. (D,E) B-scan images without and with decorrelation signals along the green arrow in panel F. (F) The merged image (grayscale = structural OCT, red = OCTA) within a central 3 × 3 mm in the HFL. (G) The magnified image within the square in panel F. The decorrelation signal appears to be a meshwork-like capillary network. (H) The merged image of OCTA in the superficial layer (green) and HFL (red). (I) The magnified image within the square in panel H shows that the decorrelation signals in hyperreflective foci correspond to projection artifacts. Scale bar = 500 μm.

