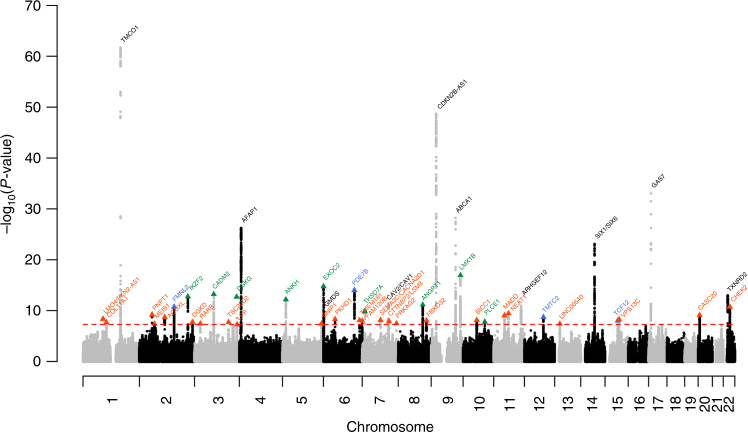
Fig. 2.
Manhattan plot of the GWAS meta-analysis (GERA + UKB) for glaucoma. Association results (–log10 P-values) are plotted for each chromosome. Names of loci and lead variants are indicated in color: previously identified loci are in black, blue triangles indicate GERA lead variants at novel loci identified in GERA, green triangles are lead UKB-identified variants at novel loci, and orange triangles are for lead GERA + UKB-identified variants at novel loci

