Fig. 4.
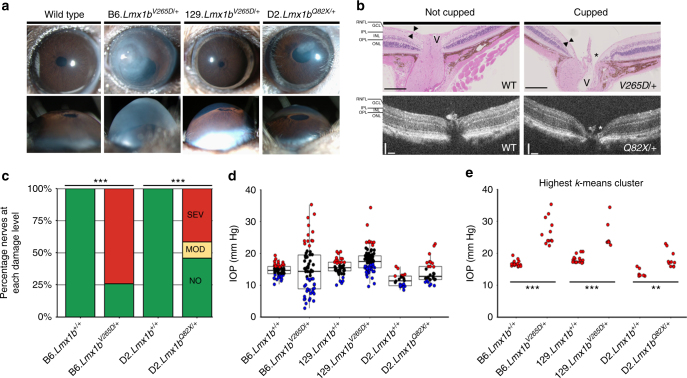
Lmx1b can induce high IOP and glaucoma in developmentally normal eyes. a Slit lamp examination of control B6.Lmx1b+/+, B6.Lmx1bV265D/+, 129.Lmx1bV265D/+, and D2.Lmx1bQ82X/+ at 9 months of age. All D2 mice were wild-type (WT) for Gpnmb. Lmx1b WT eyes on all backgrounds were developmentally normal and so only the B6 controls are shown. B6 mutant mice have a severe developmental phenotype, involving severely malformed eccentric pupils, irido-corneal strands, corneal haze, and corneal scleralization (upper panels). These developmental phenotypes are much milder or absent in mutants on the other backgrounds, with about 50% of mutants on the 129 background having very mild pupillary abnormalities. No mutants on the D2 background had developmental abnormalities. In WT eyes, we can distinguish a very shallow anterior chamber, and, as a result of IOP elevation, the chamber depth increases to different degrees in mutants on each genetic background (lower panels). N ≥ 30 for each group. b Optic nerve cupping (asterisks) and retinal nerve fiber layer (RNFL) thinning (arrowheads), two hallmarks of glaucoma, was present in mutant eyes with severely affected optic nerves but not in WT eyes (10 months’ B6 H&E-stained sections, top panels, and 13 months’ D2 eyes SD-OCT images shown, bottom panels). Scale bar = 200 μm for H&E-stained images and 100 μm for SD-OCT images. V optic vessel, GCL ganglion cell layer, IPL inner plexiform layer, INL inner nuclear layer, OPL outer plexiform layer, ONL outer nuclear layer. c Nerve damage plots for 10-month B6 and 14.5-month-old D2 eyes N ≥ 24 for each group, Fisher’s exact test: ***P < 0.001. d A proportion of mice carrying the Lmx1b mutations exhibit elevated IOP on all three strain backgrounds as compared to their respective controls. IOP values are clustered within each group using k-means clustering (k = 3), blue = low IOP cluster, black = average IOP cluster, red = high IOP cluster. N ≥ 24 for each group, 6 months old shown. e IOP values in the high IOP clusters are significantly elevated in Lmx1b mutant mice compared with WT controls. Statistical analysis was done using a one-way ANOVA followed by Tukey’s HSD, ***P < 0.001, **P < 0.01

