Figure 1.
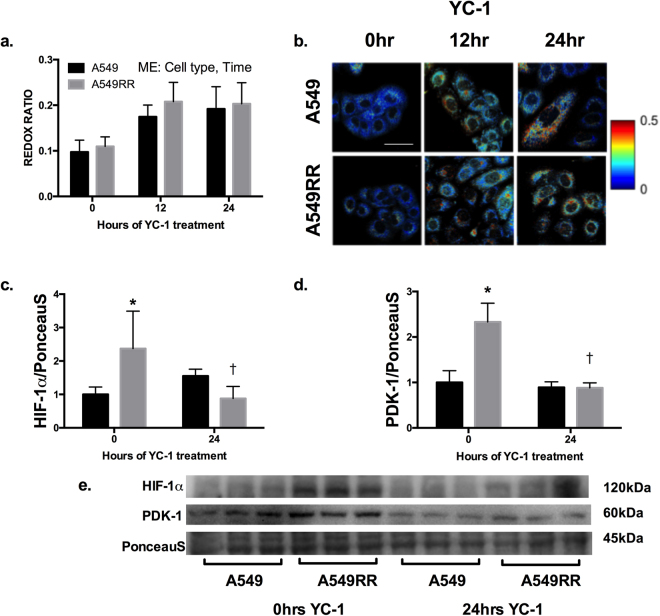
Optical redox ratio (ORR) demonstrates reduced glycolytic phenotype following 24 hours of YC-1 treatment. ORR of A549 and A549RR cells before, 12 and 24 hours following 50 μM YC-1 treatment to inhibit HIF-1 (a,b). Immunoblotting for HIF-1α (c) and PDK-1 (d) before and 24 hours following YC-1 treatment to verify in of HIF-1α. Representative immunoblots were horizontally cropped at the molecular weight indicated (e). Uncropped exposures can be seen in Supplemental Fig. 1. Experiments were performed in triplicate across 3 independent experiments. *p < 0.05 compared to A549 0 hr control, †p < 0.05 compared to A549RR 0hrs. Scale bar in images represents 50 μm. ME – Main effect of cell type and time; however, no significant interactions were found between the two main effects.

