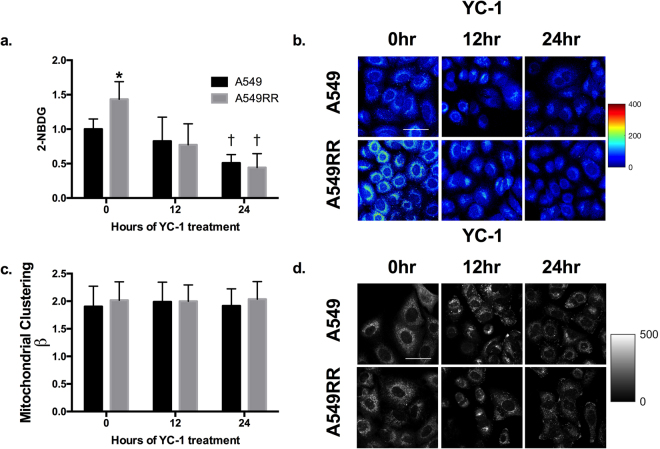
Figure 2.
Glucose uptake and mitochondrial clustering following inhibition of HIF-1α. Glucose uptake assessed by 2-NBDG fluorescence in A549 and A549RR cells before, 12 and 24 hours following 50 μM YC-1 treatment (a,b). Mitochondrial organization was evaluated through Fourier-based image analysis of the NADH images (c,d). *p < 0.05 compared to A549 0 hr control, †p < 0.05 compared to same cell type at 0 hours. Scale bar in images represents 50 μm.

