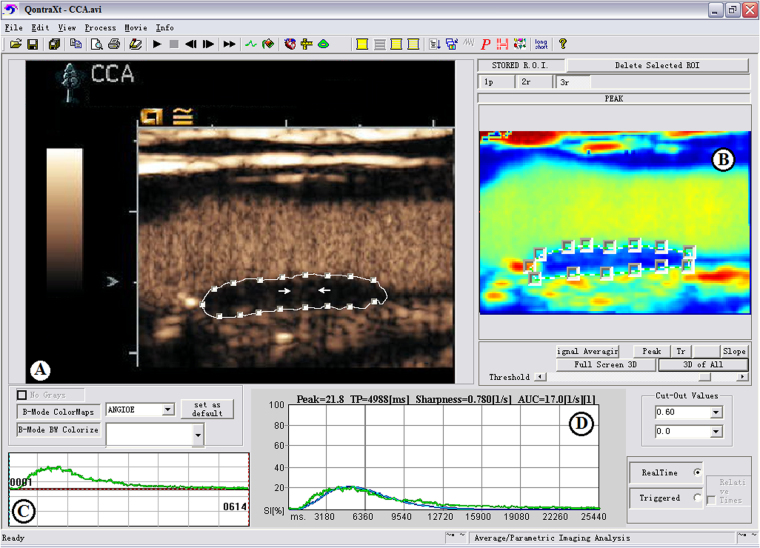
Figure 5.
The automated quantification of intraplaqueneovasculization (IPN) of carotid plaque using QontraXt. (A) A manual region of interest (ROI) was placed to enclose the whole area of the plaque with IPN demonstrated in the plaque ROI (arrow). (B) Parametric imaging: Parametric imaging results into four images that corresponds to the maps of the curve fitting parameters. (C) The time-intensity curve (green-colored curve). (D) Parametric fitting curve: time-intensity fitting curve (blue curve). Numeric values of peak, TP, sharpness, and AUC were automatically calculated based on the time-intensity curve and are shown at the top of the graphs.

