
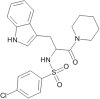
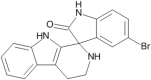
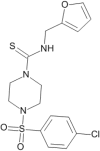
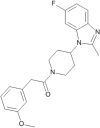
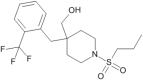
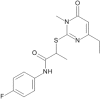
Table 1.
Chemical structures of the eleven Pathogen Box compounds found here to cause an increase in [Na+]cyt in isolated parasites.
| Compound Identifier | Location in Pathogen Box | Structure | Magnitude of [Na+]cyt increase (increase in SBFI fluorescence ratio as a % of that induced by KAE609)a |
|---|---|---|---|
| MMV020623 | Plate B, A09 |

|
63% |
| MMV020136 | Plate B, C07 |

|
68% |
| MMV020710 | Plate B, C08 |

|
106% |
| MMV020520 | Plate B, D08 |

|
76% |
| MMV085210 | Plate B, F11 |
|
21% |
| MMV006239b | Plate B, G07 |
|
63% |
| MMV000858 | Plate B, G08 |
|
70% |
| MMV020391 | Plate B, H09 |

|
43% |
| MMV020081 | Plate D, D03 |
|
89% |
| MMV001059 | Plate D, G03 |
|
70% |
| MMV688980 | Plate D, H11 |
|
27% |
aThe magnitude of [Na+]cyt increase for each of the compounds is indicated by the increase in the average fluorescence ratio of SBFI-loaded isolated trophozoites at 24–25 min following the addition of the compound (1 µM), expressed as a % of the increase induced by the addition of the putative PfATP4 inhibitor KAE609 (50 nM).
bMMV006239 is structurally similar to the spiroindolone compounds KAE609 (cipargamin) and NITD246.