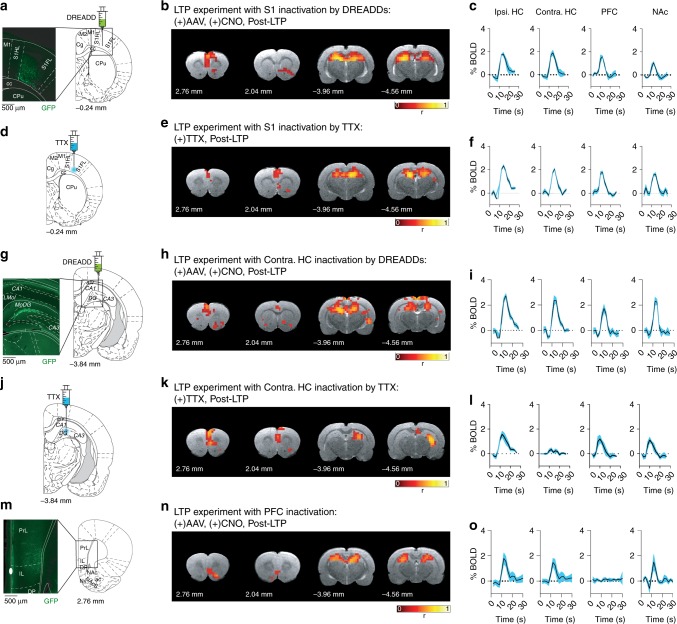
Fig. 5.
Targeted inactivation of different brain regions. a–c Pharmacogenetic inactivation of S1 cortex. a Location of the AAVs injection in the corresponding section of the stereotaxic map and representative histological staining showing the construct expression (inset). b Shows the statistically thresholded (p < 0.001, corrected) fMRI maps of a representative animal and c the averaged BOLD signals across subjects (n = 2) and across region of interest. As in Fig. 4, S1 inactivation does not disrupt the long-range network formed upon LTP induction. d–f Inactivation of S1 with TTX (see Supplementary Note 9, for experimental details). Same as a-b-c experiments with S1 inactivation using the sodium channel blocker TTX (n = 3). Both fMRI maps and BOLD signals demonstrate formation of the HC-PFC-NAc network triggered by LTP (p < 0.001). g–l Pharmacogenetic (g, h, i, n = 5) and TTX (j, k, l, n = 4) inactivation in the contralateral HC (n = 5). As shown in the individual fMRI maps and averaged BOLD signals (p < 0.001), none of the inactivation strategies targeting the contralateral HC prevented the formation of the HC-PFC-NAc network. m–o Pharmacogenetic inactivation of the PFC (n = 5). AAVs injection targeted to the anterior part of the PFC (m) prevents its activation by performant path stimulation, as expected by the pharmacogenetic intervention, but does not abolish the formation of the long-range HC-NAc connections (p < 0.001), as predicted by the theory (n, o)

