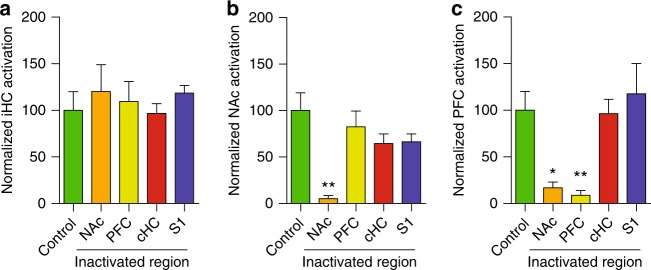
Fig. 6.
Group analysis of network inactivation. The number of nodes in the relevant networks is quantified after LTP induction with or without targeted inactivation and normalized relative to the control, fully active, condition. a Proportion of nodes recruited by perforant pathway stimulation in the ipsilateral HC under control conditions (100%) and after inactivation of the NAc, PFC, contralateral HC (cHC), and S1, as indicated in the x-axis. Analysis of variance across groups demonstrates no statistical differences (ANOVA, F4,24 = 0.3641, p = 0.8317). b Proportion of nodes recruited in the NAc following targeted inactivation in the structures indicated in the x-axis. ANOVA demonstrates statistically significant differences between groups (F4,24 = 4.841, p = 0.0053) and post-hoc Bonferroni test finds the only significant difference in NAc recruitment when the NAc is directly inactivated (p < 0.01), as expected from the experimental manipulation, but no effect under PFC, cHC, or S1 inactivation. c Proportion of nodes recruited in the PFC following targeted inactivation in the structures indicated in the x-axis. ANOVA demonstrates statistically significant differences between groups (F4,24 = 6.416, p = 0.0012) and post-hoc Bonferroni test identifies strong reductions in both PFC (p < 0.01), expected from the experimental manipulation, but also NAc (p < 0.05), indicating the disintegration of the long-range HC-PFC-NAc network under NAc inactivation

