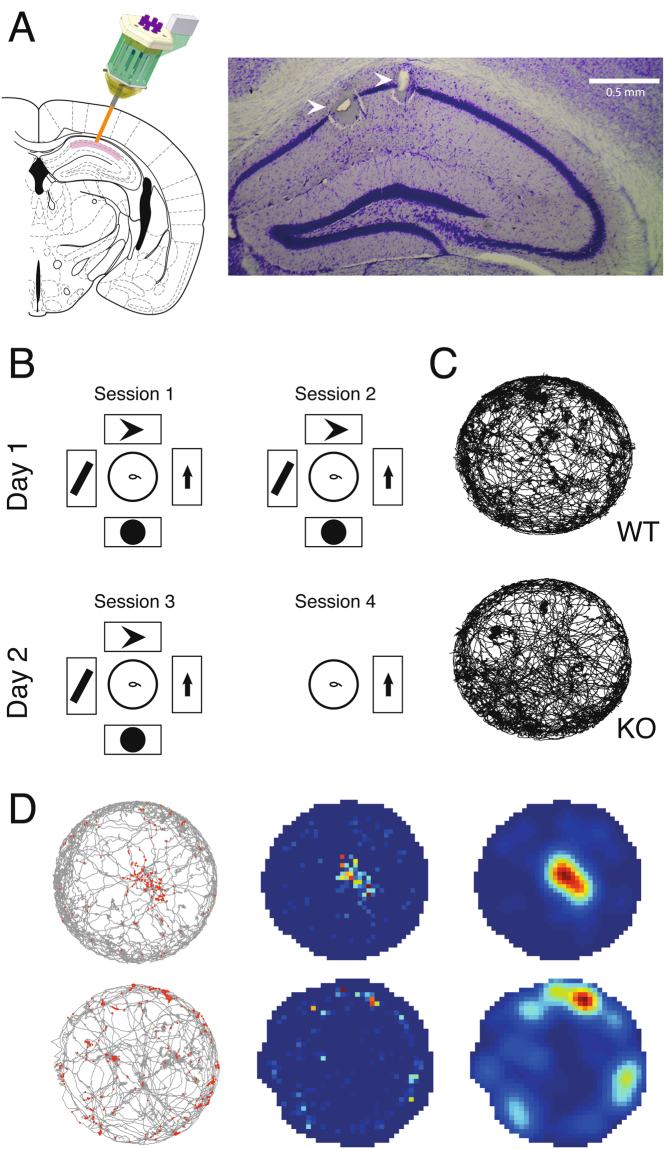
Figure 1.
Experimental Setup. (A) Histology. Left, schematic of microdrive implantation target, modified from50. Right, coronal section showing the recording locations of two tetrodes in dorsal hippocampus CA1 (arrowheads). (B) Schematic of the behavioral protocol. On two consecutive days, in two sessions per day, animals freely explored a circular open field arena (middle). The arena was surrounded by four posters of geometric figures in the first three sessions, and only one poster in the fourth session. (C) Behavior. Accumulated trajectories of a WT and a KO animal exploring the arena during an example session. (D) Illustration of the three steps of firing map construction, for an example WT place cell (top row) and an example KO place cell (bottom row). Left, accumulated trajectory of animal exploration during the session, with spikes recorded from a single pyramidal cell superimposed in red. Middle, heat map of these spikes created by binning and normalizing this data. Right, smoothed heat map of these binned and normalized spikes.

