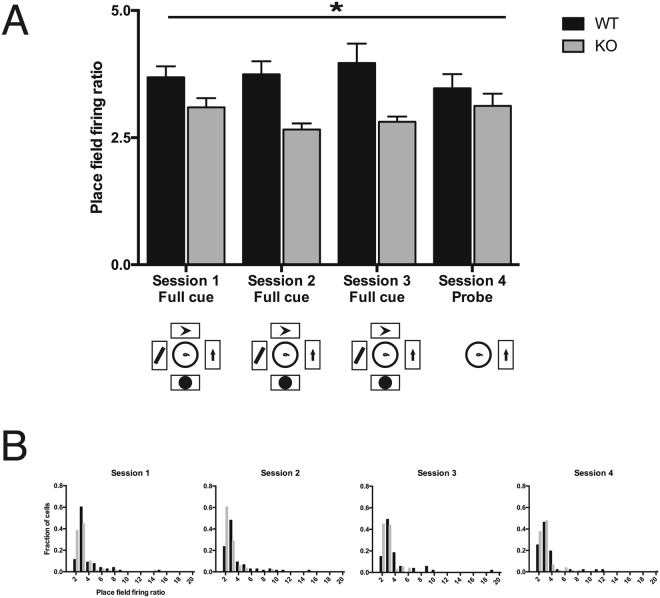
Figure 2.
Spatial specificity of place cells per session. (A) Place field firing rate increase of WT (black) and Fmr1-KO (gray) pyramidal cells within their respective fields, relative to the firing rate of each cell outside its field (the place field firing ratio). Data are represented as mean ± SEM. Session 1: WT 80 cells, mean = 3.69, SEM = 0.22; KO 81 cells, mean = 3.09, SEM = 0.18. Session 2: WT 77 cells, mean = 3.75, SEM = 0.25; KO 91 cells, mean = 2.66, SEM = 0.12. Session 3: WT 55 cells, mean = 3.97, SEM = 0.38; KO 78 cells, mean = 2.81, SEM = 0.10. Session 4: WT 52 cells, mean = 3.47, SEM = 0.28; KO 80 cells, mean = 3.12, SEM = 0.24. (B) Distributions of place field firing rate increase of WT (black) and Fmr1-KO (gray) pyramidal cells within their respective fields, relative to the firing rate of each cell outside its field (the place field firing ratio). *P < 0.0001 main effect of genotype (two-way genotype x session ANOVA: F1,586 = 25.55). There was no effect of session and no interaction effect.

