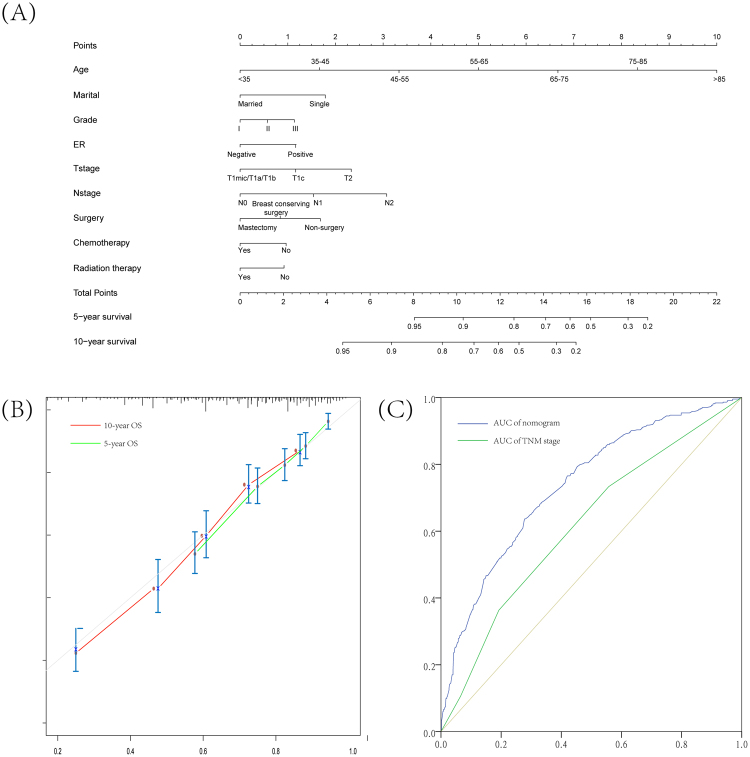
Figure 6.
Nomogram and the internal calibration for predicting 5-year and 10-year overall survival of early male breast cancer patients. (A) Nomogram for predicting proportion of patients with 5-year and 10-year OS. (B) Plots depict the calibration of model in terms of agreements between predicted and observed 5-year and 10-year outcomes. Model performance is shown by the plot, relative to the 45-degree line, which represents perfect prediction. (C) ROC curves showed sensitivity and specificity of overall survival prediction by the TNM stage and risk score based on nomogram.

