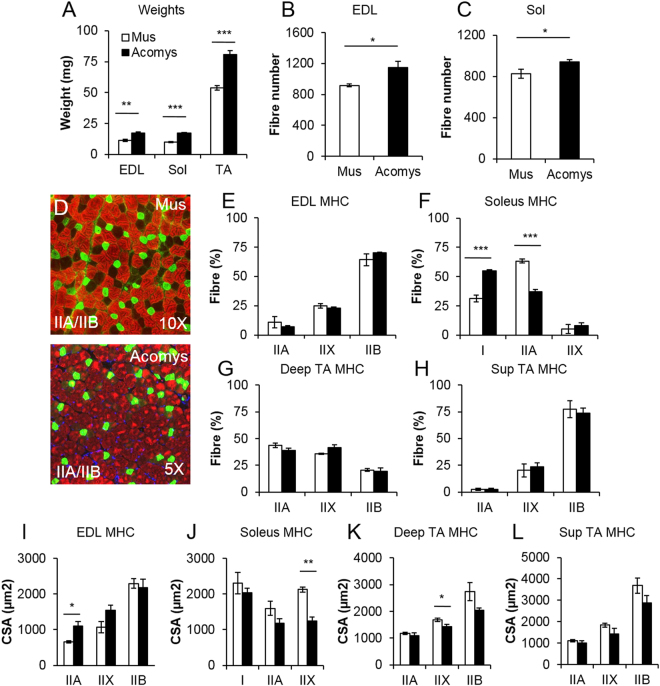
Figure 1.
(A) Cahirinus skeletal muscle mass increase through fibre hyperplasia. (A) Skeletal muscle mass in A. cahirinus compared to C57/Bl6. (B,C) Fibre number increase in EDL and soleus of A. cahirinus compared to C57/Bl6. (D) Example of MHCIIA and MHCIIB protein expression in the EDL muscle from M. musculus and A. cahirinus. (E–H) MHC fibre distribution in (E) EDL, (F) Soleus, (G) deep TA and (H) superficial TA from M. musculus and A. cahirinus. (I–L) Comparison of cross-sectional fibre areas assigned to specific MHC isoforms for the (I) EDL, (J) Soleus, (K) deep TA and (L) superficial TA from M. musculus and A. cahirinus. n = 4/5 animals for each measure. Statistical analysis performed by two-tailed t-test. *<0.05, **<0.01, ***p < 0.001.

