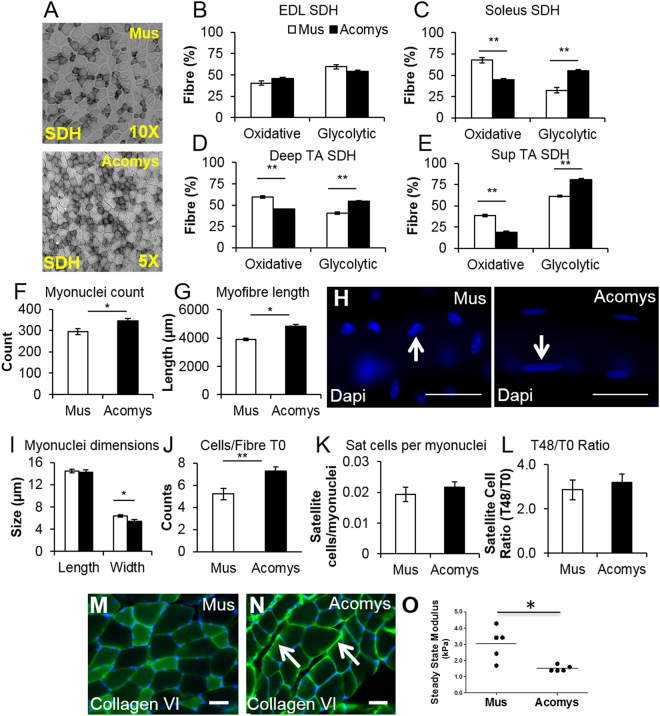
Figure 2.
Metabolic, connective tissue and stiffness of A. cahirinus skeletal muscle and satellite cell profiling. (A) SDH staining of EDL muscle from M. musculus and A. cahirinus. (B–E) SDH activity in (B) EDL, (C) Soleus, (D) deep TA and (E) superficial TA from C57/Bl6 and A. cahirinus. Soleus and all parts of the TA display decreased proportion of SDH+ fibres compared to Mus. (F) Quantification of myonuclei content in fibres from the EDL of M. musculus and A. cahirinus. (G) EDL Myofibre length M. musculus and A. cahirinus. (H) DAPI stained nuclei in EDL fibres (arrow) of M. musculus and A. cahirinus. Scale bar = 150 μm. (I) Quantification of EDL myonuclei dimensions. (J) Quantification of satellite cell number on freshly isolated EDL fibres through Pax7 immunocytochemistry. (K) Frequency of EDL satellite cells relative to myonuclei. (L) Proliferation of satellite cells measured as a ratio of number of progenitors at 48 h in relation to the number of satellite cells at start of culture (T0). (M) Collagen VI immunofluorescence of normal EDL of M. musculus showing a decrease in immunoreactivity. Scale bar = 50 μm. (N) Collagen VI immunofluorescence of normal EDL of A. cahirinus showing strong immunoreactivity (arrows). Scale bar = 50 μm. (O) Measurements of the stiffness of freshly dissected TA muscle from M. musculus and A. cahirinus. Line shows the average value. Statistical analysis performed by two-tailed t-test. *<0.05, **<0.01.

