Figure 3.
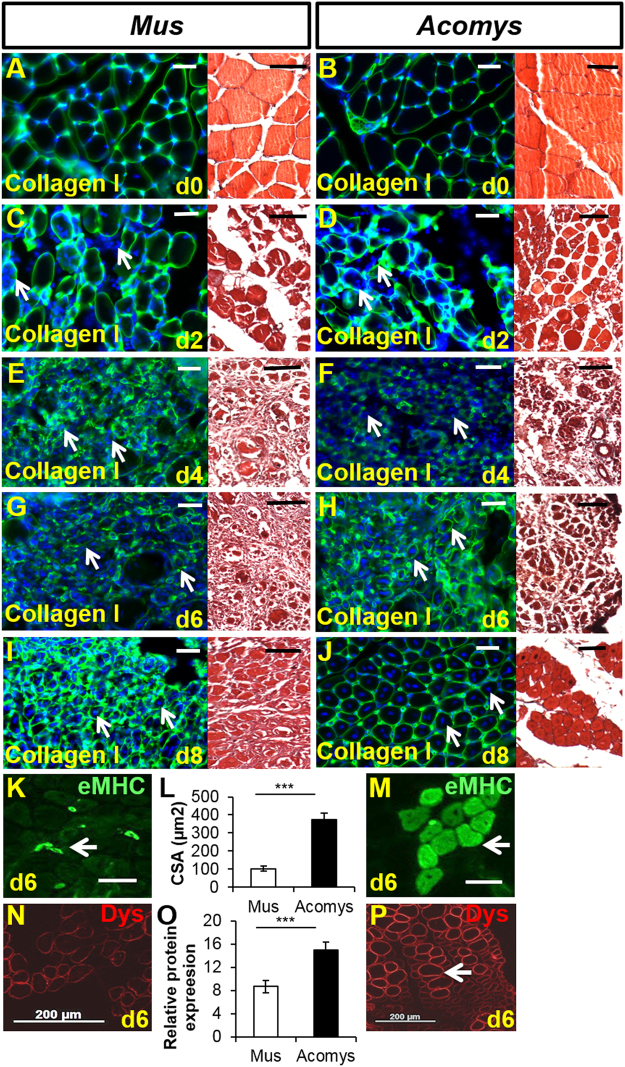
Dynamics of skeletal muscle regeneration after single CTX injection. Green = col I, blue = Hoescht stained nuclei. (A,B) Normal TA structure. Scale bars = 50 μm, same scales for A–J. (C,D) 2 days after CTX injection the myofibre membranes are losing their definition and many cells have invaded the area (arrows). (E,F) After 4 days there is complete destruction of the myofibres, a huge invasion of cells and proliferation of endogenous cells (arrows). (G,H) By day 6 there is a suggestion of reformation of myofibre membranes (arrows). (I,J) By day 8 new fibres have regenerated in A. cahirinus (right columns) with centrally located nuclei whereas in M. musculus (left columns) the process is by no means complete (arrows). (K–M) Examination of eMHC as a gauge of TA regeneration at day 6. (K) Example of eMHC+ fibres (arrow) in M. musculus and (M) A. cahirinus. (L) Quantification of regenerated fibres (eMHC+ fibre size). (N–P) Immunocytochemical staining and quantification for Dystrophin in regenerating areas of (N) M. musculus and (P) A. cahirinus. Note higher levels of Dystrophin in A. cahirinus (arrow). (O) Quantification of Dystrophin expression at the sarcolemma. Statistical analysis performed by two-tailed t-test. ***p < 0.001.

