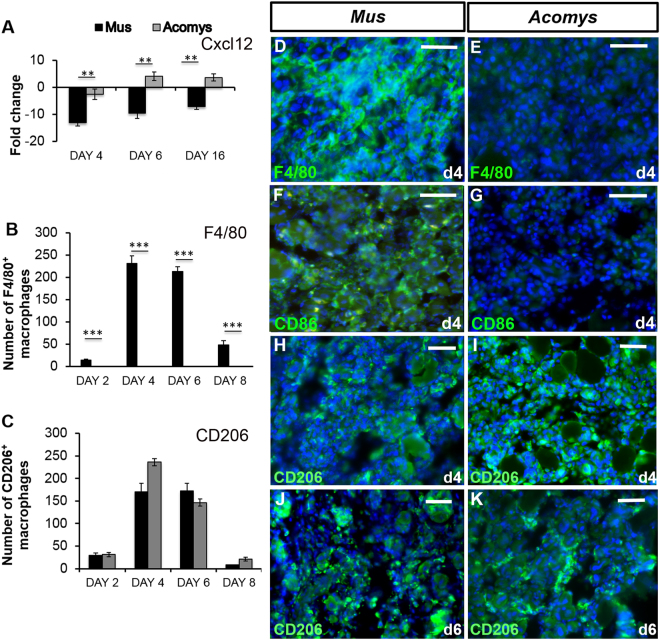
Figure 5.
Macrophage profiling during muscle regeneration. (A) RT-qPCR analysis of gene expression of Cxcl2 on days 4, 6 and 16 after CTX injection-induced injury. All results are relative to day 0 (normal TA) and error bars represent standard deviation. (B) counts of F4/80 macrophages showing a peak in M. musculus on days 4 and 6 and an absence in A. cahirinus. (C) counts of CD206 macrophages showing a peak at days 4 and 6 and equivalent numbers in M. musculus and A. cahirinus. (D–E) F4/80 immunocytochemistry in M. musculus (left column) and A. cahirinus (right column) in the TA at days 4 after CTX injection. Many F4/80 expressing cells (green) are seen in M. musculus whereas there is no positive reaction in A. cahirinus. Scale bars = 100 μm. (F–G) CD86 immunocytochemistry in M. musculus and A. cahirinus in the TA at days 4 after CTX injection. Many CD86 expressing cells (green) in M. musculus are seen whereas there is no positive reaction in A. cahirinus. Scale bars = 100 μm. (H–K) CD206 macrophage immunocytochemistry in M. musculus and A. cahirinus in the TA at days 4 and 6 after CTX injection. Both species show similar numbers of positive cells (green). Scale bars = 100 μm. Statistical analysis performed by two-tailed t-test. ** < 0.01, ***p < 0.001.

