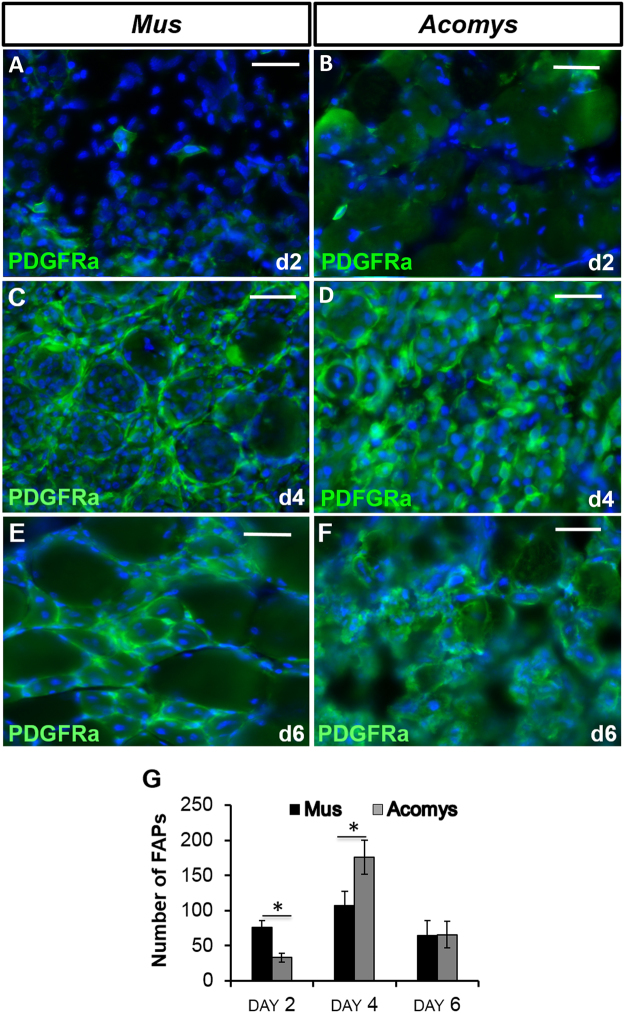
Figure 6.
Fibroadipogenic cell profiling during skeletal muscle regeneration. (A–F) PDGFRα immunocytochemistry as a marker of FAPs in M. musculus (left column) and A. cahirinus (right column) TA at times indicated after CTX injection. Similar numbers are seen in both species at equivalent times. (G) Counts of PDGFRα+ FAPS in M. musculus and A. cahirinus showing peak levels at day 4. Statistical analysis performed by two-tailed t-test. *<0.05.

