Fig. 2.
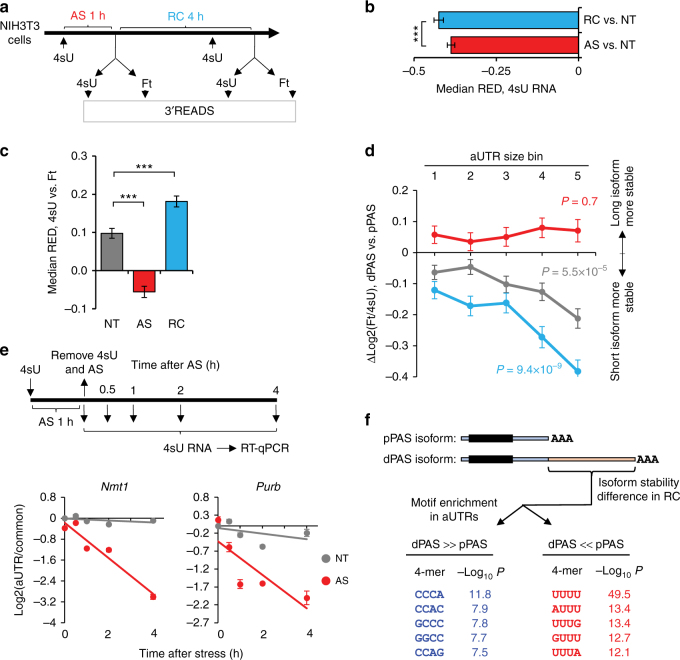
Both preferential expression of short 3′UTR isoforms and degradation of long 3′UTR isoforms take place in stressed cells. a Schematic of experimental design. Cells were labeled with 4sU for 1 h right before harvest during arsenic stress (AS) or recovery (RC), as well as in non-treated control (NT) cells. 4sU-labeled and flow-through (Ft) RNAs were subject to APA analysis with 3′READS. b Comparison of global 3′UTR length changes between AS or RC cells and NT cells using RNA in the 4sU fraction only. The NT result was based on two replicates, and AS and RC results on one sample each. Error bars are standard deviation of median RED based on random sampling of the data for 20 times (see Methods for details). Three asterisks indicate P < 0.001 (Wilcoxon test). c Comparison of global 3′UTR length differences between the 4sU and Ft fractions, as indicated by median RED, under NT, AS (1 h), and RC (4 h) conditions. The NT result was based on two replicates, and AS and RC results on one sample each. Error bars are standard deviation of median RED as in b. Three asterisks indicates P < 0.001 (Wilcoxon test). d Stability difference between 3′UTR APA isoforms, as measured by Δlog2(Ft/4sU) between dPAS and pPAS isoforms, for gene groups with different aUTR sizes. Genes were divided into five bins as in Fig. 1f. The median Δlog2(Ft/4sU) value for each gene bin is plotted for NT (gray), AS (red), or RC (blue) conditions. Error bars are standard error of mean based on all genes in each bin. P-values (Wilcoxon test) comparing genes in bin 1 vs. in bin 5 are shown. e Validation of mRNA decay analysis. Top, schematic of experimental design. NIH3T3 cells were subject to 1 h of AS, during which 4sU was used to label newly made RNA. 4sU-labeled RNA was analyzed by RT-qPCR at different time points after removal of stress and 4sU. Bottom, RT-qPCR result with primer sets targeting aUTR and common regions of APA isoforms. NT cells were used as a control. f Sequence motif analysis of aUTR sequences of genes whose long 3′UTR isoforms were more stable than short 3′UTR isoforms (dPAS » pPAS, genes with top 10% of ΔLog2(Ft/4sU), dPAS vs. pPAS in RC) or the opposite (dPAS « pPAS, genes with bottom 10% of ΔLog2(Ft/4sU), dPAS vs. pPAS in RC) in the RC sample. Top five enriched tetramers in each group of genes are shown. Their P-values (Fisher’s exact test) are indicated

