Fig. 4.
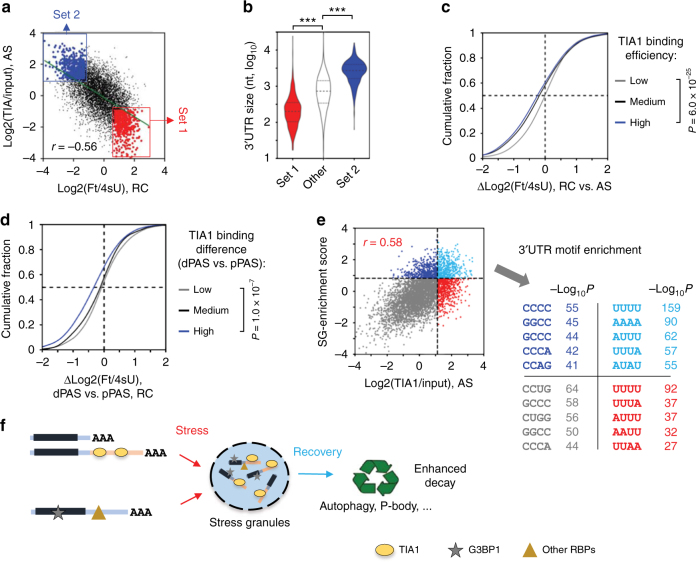
TIA1 binding correlates with SG enrichment and mRNA decay after stress. a Comparison of TIA1 binding in AS cells and mRNA stability in RC cells. Each dot is a transcript with a defined PAS. Red dots (gene set 1) are transcripts with low TIA1 binding in AS (bottom 20%) and high stability in RC (top 20%). Blue dots (gene set 2) are transcripts with high TIA1 binding in AS (top 20%) and low stability in RC (bottom 20%). b Violin plots of 3′UTR length for three transcript sets defined in a. Significance of difference between transcript sets is indicated (***, P < 0.001, Wilcoxon test). c Cumulative distribution of difference in mRNA stability between RC and AS cells (Δlog2(Ft/4sU)) for transcripts with different TIA1 binding efficiencies. High, medium, and low TIA1 binding transcripts were top 1/3, middle 1/3, and bottom 1/3 based on log2(TIA1/Input), respectively. d Cumulative distribution of difference in stability between APA isoforms in RC (ΔLog2(Ft/4sU, RC), dPAS vs. pPAS) for genes with low (gray), medium (black), or high (blue) difference in TIA1-binding between APA isoforms (ΔLog2(TIA1/Input, AS), dPAS vs. pPAS). e Left, scatter plot showing comparison of TIA1 binding and SG enrichment under AS. Each dot represents a mouse gene and its homologous human gene. SG-enrichment score is based on association of transcripts with G3BP1 in the SG core, and TIA1 binding is log2(TIA1/Input) in AS cells. Right, enriched tetramers in the 3′UTRs of genes from different groups (as colored in the scatter plot). f A model summarizing TIA1 binding to 3′UTR isoforms, SG association during stress, and mRNA decay during recovery. Some transcripts are recruited to SGs independent of TIA1

