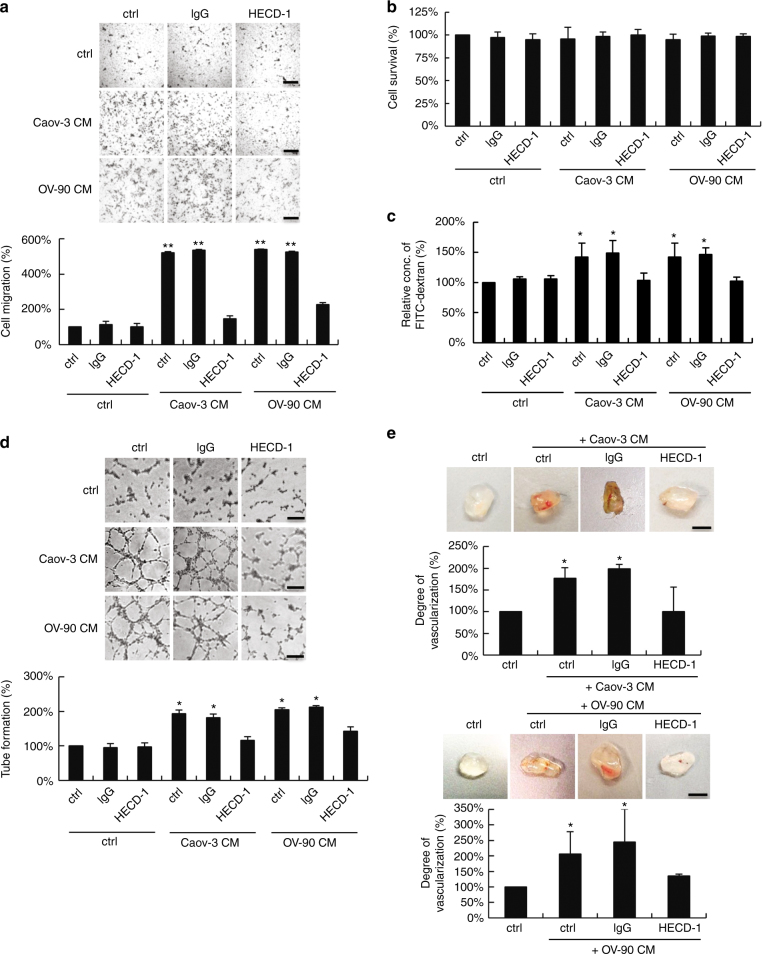
Fig. 1.
sE-cad promotes angiogenesis in vitro and in vivo. a Cell migration assay of HUVEC treated with control (ctrl) or immunodepleted conditioned medium (CM) of Caov-3 and OV-90. Upper: Representative images of HUVEC migration. Lower: Quantification of the percentage change of the number of migrated cells. Bar, 100 μm. b Proliferation assay of HUVEC treated with control (ctrl) or immunodepleted conditioned medium (CM) of Caov-3 and OV-90 in the presence or absence of E-cadherin neutralizing antibodies, HECD-1 (100 μg mL−1). c Permeability analysis of HUVEC measured by the percentage change of FITC–dextran flux (excitation 485 nm, emission 535 nm) treated with control (ctrl) or immunodepleted conditioned medium (CM) of Caov-3 and OV-90. d Tube formation assay of HUVEC treated with control (ctrl) or immunodepleted conditioned medium (CM) of Caov-3 and OV-90. Upper: Representative images of HUVEC tube formation assay. Lower: Quantification of the percentage change of the number of branching points. Bar, 100 μm. e In vivo Matrigel plug implant model using C57/BL6 mice subcutaneously injected with control (ctrl) or immunodepleted conditioned medium (CM) of Caov-3 and OV-90. In vivo neovascularization is measured by the Drabkin’s reagent kit after 7 days. Upper: Representative images of excised Matrigel plug. Lower: Quantification of the percentage change in hemoglobin content. Bar, 5 mm. For in vivo Matrigel plug model, n = 6 per group, and were conducted twice. For the other assays, n = 3 per group, all experiments were repeated three times. Error bar indicates SD of the mean. *P < 0.05, **P < 0.01 versus untreated control using one-way analysis of variance followed by Tukey’s least significant difference post hoc test

