Fig. 2.
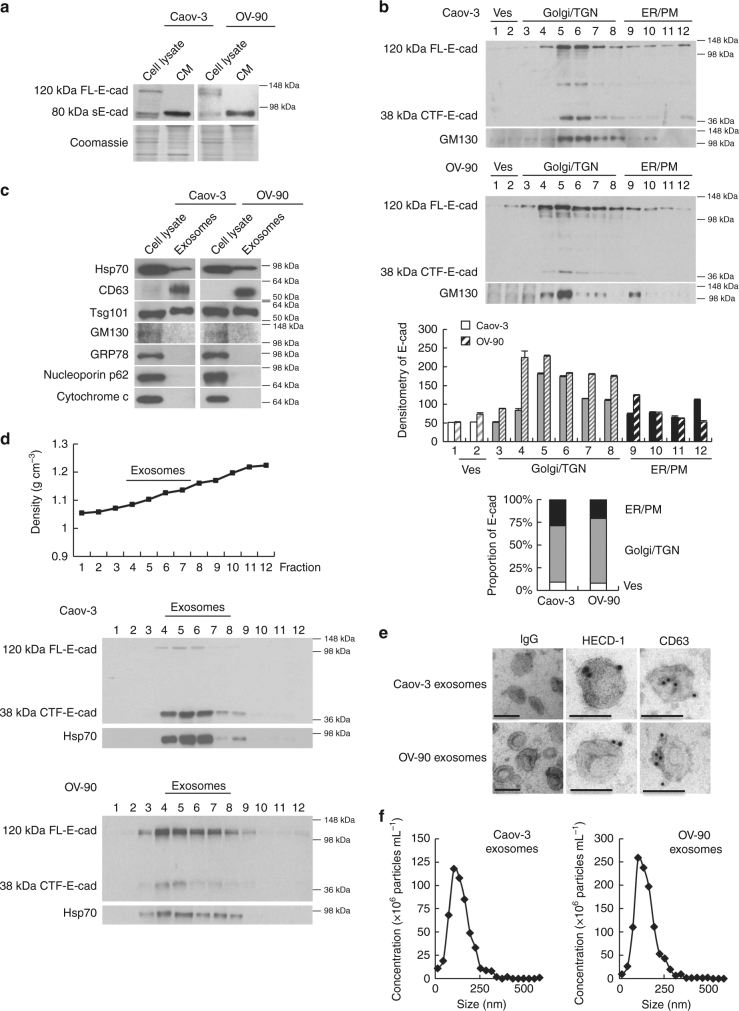
Intracellular cleavage of sE-cad and the release of sE-cad-positive exosomes. a Western blot analysis of E-cadherin in total cell lysate and conditioned medium (CM) of Caov-3 and OV-90. b Western blot analysis of the subcellular localization of E-cadherin in Caov-3 and OV-90 by sucrose density gradient fractionation. Ves vesicles, TGN trans-Golgi network, ER endoplasmic reticulum, PM plasma membrane. Upper: Representative western blot images. Lower: Densitometry of FL-E-cad. c Western blot analysis of the protein composition of exosomes isolated from Caov-3 and OV-90. d Sucrose density gradient fractionation of exosomes isolated from Caov-3 and OV-90. Upper: Densities (g cm−3) of each sucrose fraction as determined by refractometry. Lower: Representative images of western blot. e Immunoelectron microscopic view of the sE-cad localization on the exosomal surface of Caov-3 and OV-90 cells at a magnification of 52,000×. Bar, 100 nm. Localization of CD63 as a positive control was visualized. No staining was found on exosomes incubated with an isotype-matched control IgG. f The number of particles per μg exosomes and median diameter were determined by nanoparticle tracking analysis. n = 3 per group, all experiments were repeated three times. Error bar indicates SD of the mean

