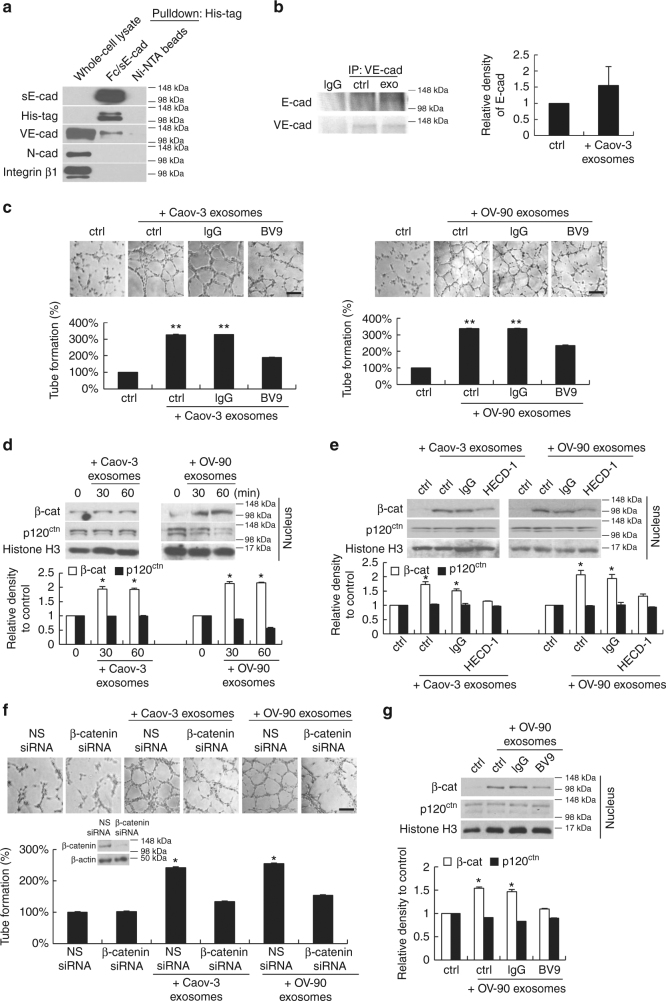
Fig. 4.
Heterodimerization of sE-cad with VE-cadherin and the activation of VE-cadherin/β-catenin signaling cascade. a His-tag pull down assay using sE-cad/Fc (10 μg mL−1) on Ni-NTA beads and HUVEC lysate (1 mg). b Immunoprecipitation assay using anti-VE-cadherin in HUVEC lysates (1 mg) untreated or treated with exosomes (25 μg mL−1). Left: Representative western blot images. Right: Densitometry of E-cadherin. c Tube formation assay of HUVEC treated with exosomes (25 μg mL−1) in the presence or absence of VE-cadherin neutralizing antibodies, BV9 (10 μg mL−1). Upper: Representative images of HUVEC tube formation assay. Lower: Quantification of the percentage change of the number of branching points. Bar, 100 μm. d Subcellular fractionation of HUVEC treated with exosomes (25 μg mL−1) for 0, 30, or 60 min. Upper: Representative images of nuclear fractions. Lower: Densitometry of β-catenin (β-cat) and p120 catenin (p120ctn). e Subcellular fractionation of HUVEC treated with exosomes (25 μg mL−1) in the presence of E-cadherin neutralizing antibodies, HECD-1 (100 μg mL−1) for 60 min. Upper: Representative images of nuclear fractions. Lower: Densitometry of β-catenin (β-cat) and p120 catenin (p120ctn). f Tube formation assay of HUVEC transiently transfected with non-specific (NS) siRNA or β-catenin siRNA (20 nM) for 24 h, treated with exosomes (25 μg mL−1). Upper: Representative images of HUVEC tube formation assay. Lower: Quantification of the percentage change of the number of branching points. Representative western blot images of β-catenin knockdown in HUVEC were also included. Bar, 100 μm. g Subcellular fractionation of HUVEC treated with exosomes (25 μg mL−1) in the presence of VE-cadherin neutralizing antibodies, BV9 (10 μg mL−1) for 60 min. Left: Representative images of nuclear fractions. Right: Densitometry of β-catenin (β-cat) and p120 catenin (p120ctn). n = 3 per group, all experiments were repeated three times. Error bar indicates SD of the mean. *P < 0.05 versus untreated control using one-way analysis of variance followed by Tukey’s least significant difference post hoc test

