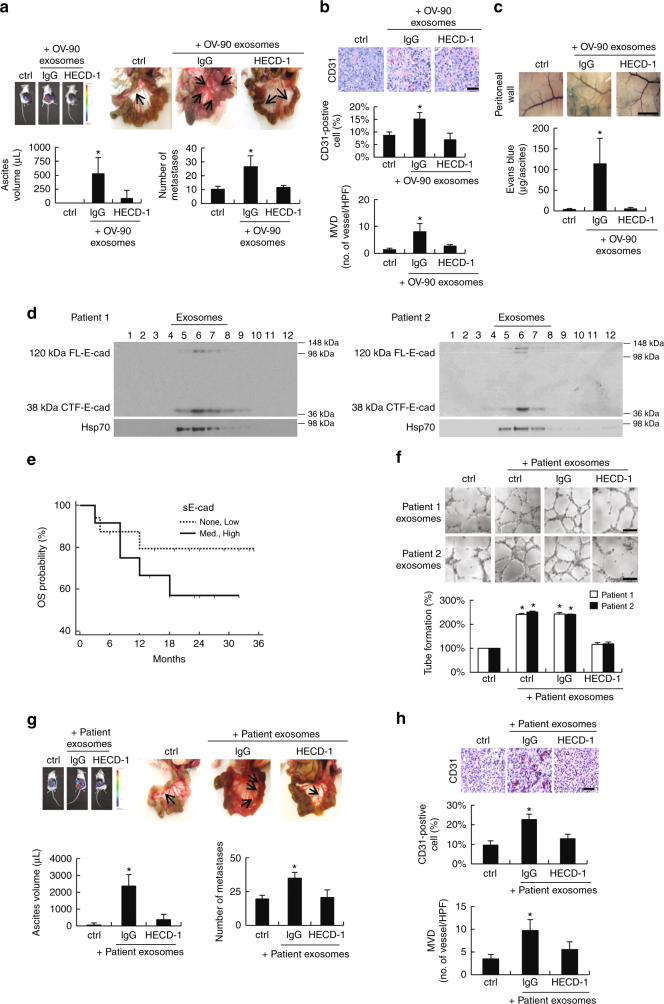
Fig. 6.
The angiogenic role of sE-cad-positive exosomes is clinically relevant. a Intraperitoneal dissemination assay using OV-90-derived exosomes. Upper left: Representative images of bioluminescence record. Upper right: metastasis in the peritoneal cavity, arrows indicate tumor. Lower: Quantification of the number of metastases and aspirated ascitic fluid. b Immunohistochemical staining of CD31. Upper: Representative images of immunohistochemical staining. Middle: Quantification of CD31-positive cells. Lower: Microvessel density (MVD) was expressed as number of vessels per high-power field (HPF). Bar, 50 μm. c NOD/SCID mice bearing HEYA8 tumors were administered with Evans blue. Upper: Representative image of Evans blue leakage in the abdominal wall. Lower: Ascites were aspirated and Evans blue content was quantified. Bar, 5 mm. d Sucrose density gradient fractionation of exosomes isolated from ovarian cancer patients’ ascites. The presence of E-cadherin is determined by western blotting. e Kaplan–Meier overall survival (OS) analysis of clinical samples of none–low or med–high sE-cad-positive exosomes expression, significance were analyzed using the log-rank test. f Tube formation assay of HUVEC treated with patients-derived exosomes (25 μg mL−1) in the presence or absence of E-cadherin neutralizing antibodies, HECD-1 (100 μg mL−1). Upper: Representative images of HUVEC tube formation assay. Lower: Quantification of the percentage change of the number of branching points. g Intraperitoneal dissemination assay using patient-derived exosomes. Upper left: Representative images of bioluminescence record. Upper right: metastasis in the peritoneal cavity, arrows indicate tumor. Lower: Quantification of the number of metastases and aspirated ascitic fluid. h Immunohistochemical staining of CD31. Upper: Representative images of immunohistochemical staining. Middle: Quantification of CD31-positive cells. Lower: MVD was expressed as number of vessels per HPF. Bar, 50 μm. n = 3 per group; and the experiment was conducted at least twice. Error bar indicates SD of the mean. *P < 0.05 versus untreated control using one-way analysis of variance followed by Tukey’s least significant difference post hoc test

