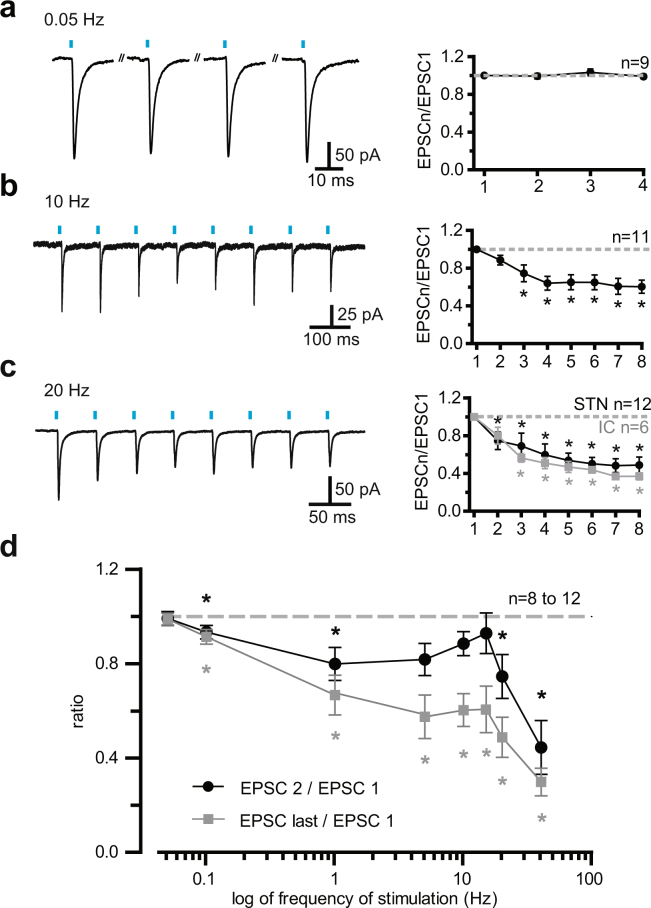
Figure 3.
Short-term plasticity of AMPA/kainate cortico-subthalamic transmission at stimulation frequencies between 0.05 and 40 Hz (a,c) Examples of EPSCs obtained at light frequencies of 0.05, 10, and 20 Hz (left) and group synaptic dynamics data (right). Mean response amplitudes were normalized to the first responses and plotted as a function of stimulus number within trains. The gray symbols in C depict the values obtained by flashing the internal capsule (and not the STN). The stimuli trains contained 8 photo-stimuli, except those at 0.05 Hz, which comprised only four photo-stimuli. (d) Summary graph of the filter properties of the cortico-subthalamic synapses. The black line and symbols display the ratios of paired pulse values, i.e. peak values of the second to the first EPSC in a train. The gray plot shows the ratio of the last to the first EPSC in a train (the 8th EPSC was the last, except for the tests at 0.05 and 0.1 Hz, where the ratio of the fourth to the first EPSC was calculated). As paired-pulse ratios exhibited no change in the 5 to 15 Hz range, a limited band-pass frequency was assumed. *Values significantly different from 1, α = 0.05, two-tailed Wilcoxon signed rank test.

