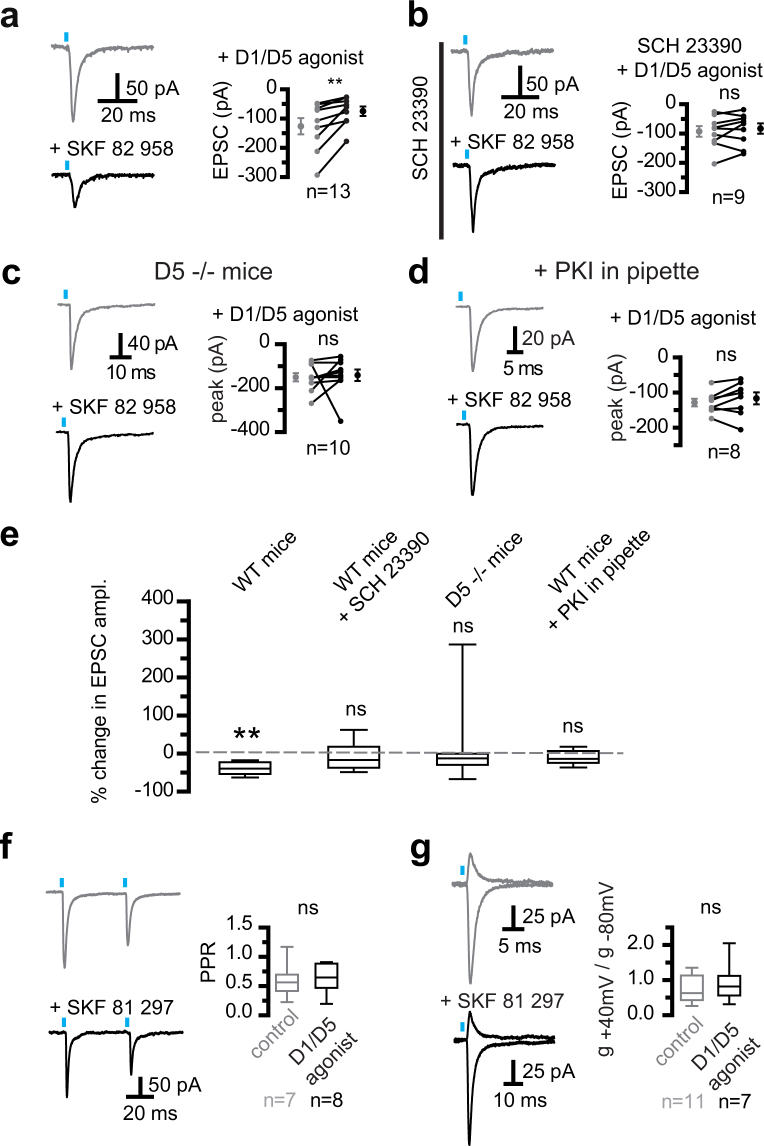
Figure 4.
D5 dopamine receptors reduced AMPA/kainate synaptic strength. (a) Activating D1/D5 receptors reduced cortico-subthalamic AMPA/kainate EPSCs in subthalamic neurons. Illustration of the action of the D1/D5 agonist, SKF 82958 (5 µM). D1/D5 agonists refer to SKF 82958, SKF 81297, or SKF 38393, at 2–5 µM. The 3 dopaminergic agonists were used to neutralize the differences in the potency of the drugs or their affinity for D5 or D1 receptors, as reported in the literature. (b) The continued presence of SCH 23390 (10 µM) prevented the action of SKF 82958 (5 µM). (c) Perfusion of 5 µM D1/D5 agonists had no significant effect in slices from D5−/− mice. (d) D1/D5 agonists (5 µM) were no longer active in the neuron sample tested with a peptide inhibitor (PKI, 20 µM in pipette solution) to intracellularly inhibit protein kinase A. In (a) to (d), traces show the currents recorded immediately prior to (top) and 10 min after agonist perfusion (bottom), and group data show individual paired values as well as mean ± sem. Two-tailed Wilcoxon matched-pairs signed rank tests were used; α was 0.05; **indicates significant changes at p = 0.0039; ns, not significant. (e) Box plot summary of the changes in EPSC amplitude obtained under the conditions depicted in a to d. The boxes present the distribution with the median as a central line. The hinges and edges display the 25th and 75th percentiles, whereas the “whiskers” display the minimal and maximal values. Action of D1/D5 agonists only reached significance in wild-type mice and not in any other 3 conditions. A Wilcoxon signed rank test was used to test a null hypothesis (no action of D1/D5 agonists). α = 0.05; **significant changes at p = 0.0039; ns, not significant. (f) No change in photo-induced paired pulse ratio (PPR) when D1/D5 receptors were activated. (g) The conductance ratio at −80 mV and +40 mV is the rectification index. It did not change in neurons bathed in D1/D5 agonists for 10–60 min. Left, representative traces of EPSCs photo-evoked at −80 mV and +40 mV in control (top) and 5 μM SKF 81 297 (bottom); right, group data showing the ratio of chord conductance at +40 mv to that at −80 mV. The reversal potential of the synaptic response in the presence of D1/D5 agonists was measured in 3 neurons, where a full I.V curve was established. Examples in (f) and (g) depict different neurons and group data report EPSCs obtained in saline alone or supplemented with 5 µM D1/D5 agonist for 10 to 60 min.

