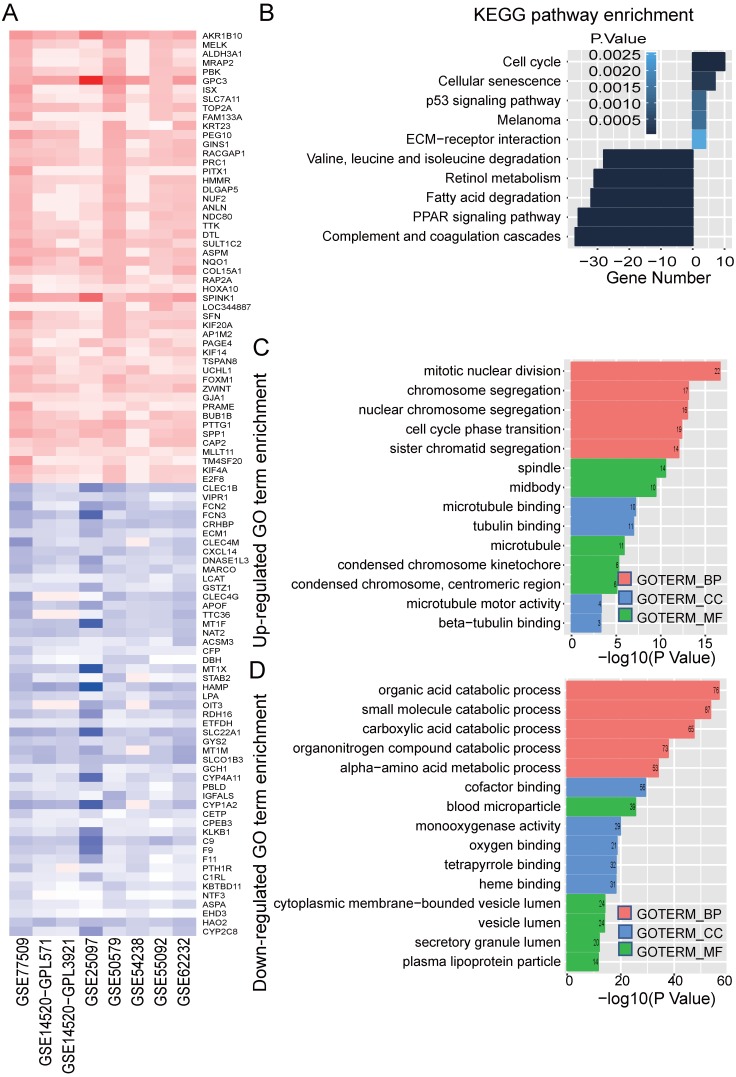
Figure 2.
Identified significance genes and enrichment analysis. (A) Heatmap showed the fold change of the top 100 significantly genes in different studies (50 up-regulated genes and 50 down-regulated genes) by Robust Rank Aggreg (RRA) methods from 7 different datasets. Each row represents the same mRNA and each column represents the same study. The fold change intensity of each mRNA in one study is represented in shade of red or blue. Red represents the fold change of up-regulated genes and blue represents the fold change of down-regulated genes, respectively, in comparison to non-tumor tissues. (B) Kyoto Encyclopedia of Genes and Genomes (KEGG) enrichment analysis of the significant genes. Up-regulated KEGG pathways are showed with horizontal axis > 0, and down-regulated genes are showed with horizontal axis < 0, respectively. The size of the horizontal axis shows the numbers of enriched genes in each KEGG pathway and the color shade of bar reflects P value. (C-D) Gene Ontology (GO) enrichment analysis of up-regulated (C) and down-regulated genes (D). The vertical and horizontal axes represent GO term and -log10 (P value) of the corresponding GO term, respectively. The number in each bar reflects the enriched gene number of each GO term. Different colors reflect main categories of GO terms: BP, biological process; CC, cellular component; MF, molecular function.

