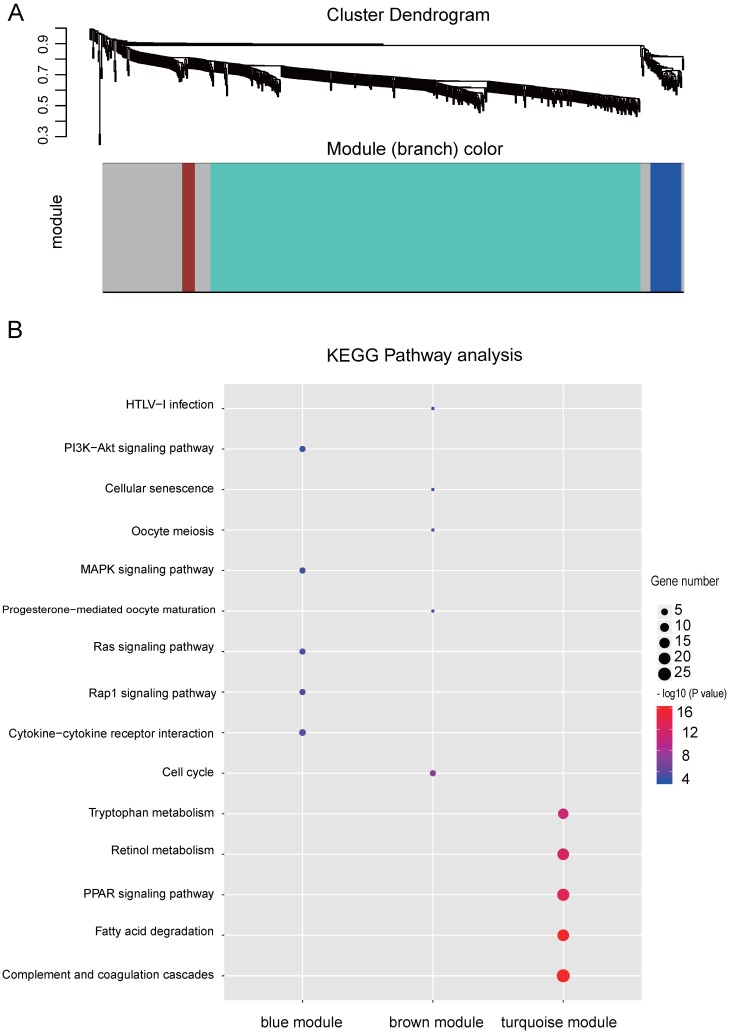
Figure 3.
WGCNA analysis of the significant genes and KEGG analysis of the key modules from WGCNA. (A) Gene clustering and module identification by WGCNA analysis based on the dataset of GSE77509. Top: clustering dendrogram showed the result of hierarchical clustering, and each line represents one gene. Bottom: the colored row below the dendrogram indicates module membership identified by the static tree cutting method. Different color represents different co-expression network modules for the significantly genes. (B) KEGG analysis of the top three modules from WGCNA. The vertical and horizontal axes represent the KEGG pathways and different modules, respectively. The size and the color intensity of a circle represent gene number and -log10 (P value), respectively.

