Figure 4.
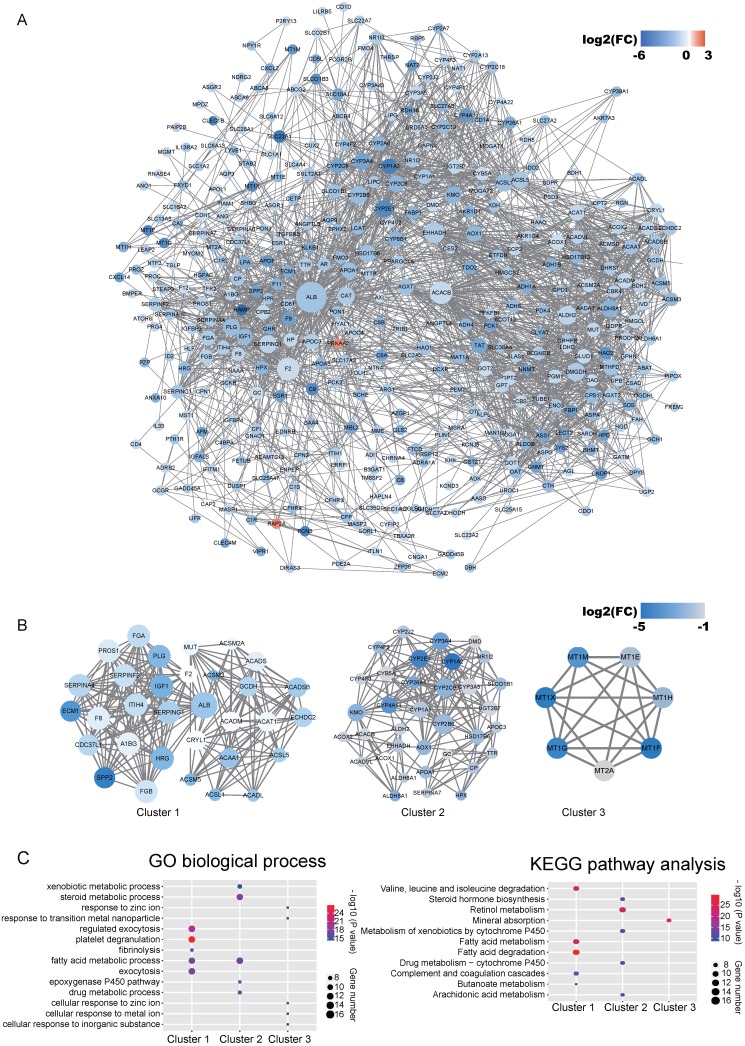
Identified discrete clusters and enrichment analysis of the turquoise module in Figure 3. (A) PPI network of genes in the turquoise module. The color intensity in each node represents the fold change of the gene in comparison to non-tumor samples (up-regulation of a gene is shown in red and down-regulation of a gene is shown in blue). The size of the circle is proportional to the score of PPI based on the STRING database. (B) Main sub-clusters from the master PPI networks. The color intensity in each node was proportional to fold change of each gene expression in comparison to non-tumor samples (up-regulation in red and down-regulation in blue). (C) KEGG and GO enrichment analysis of the top three sub-clusters. The vertical and horizontal axes represent the GO biological process /KEGG pathways and different sub-clusters, respectively. The size and the color intensity of a circle represent gene number and -log10 (P value), respectively.

