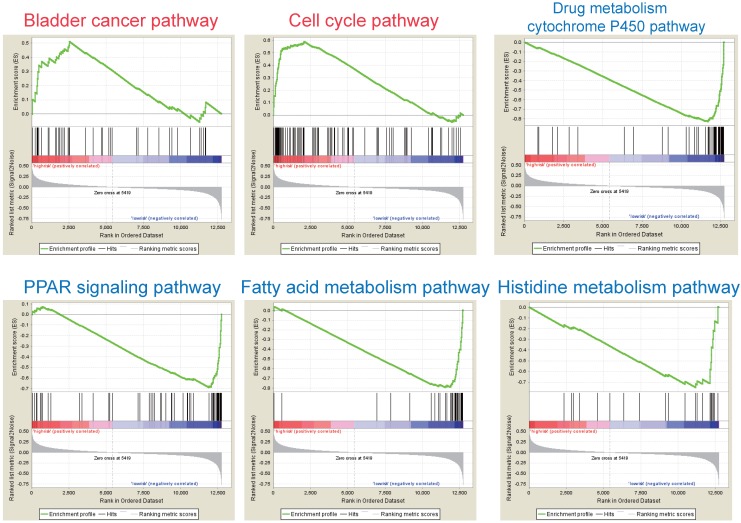
Figure 7.
GSEA analysis of the three prognostic genes. GSEA analysis of the differentially expressed genes between the high-risk versus low-risk group. Only two significantly functional gene sets were enriched for high-risk group (marked in red), whereas only four most significantly enriched functional gene sets were listed for low-risk group (markered in blue) in HBV-associated HCC samples.

