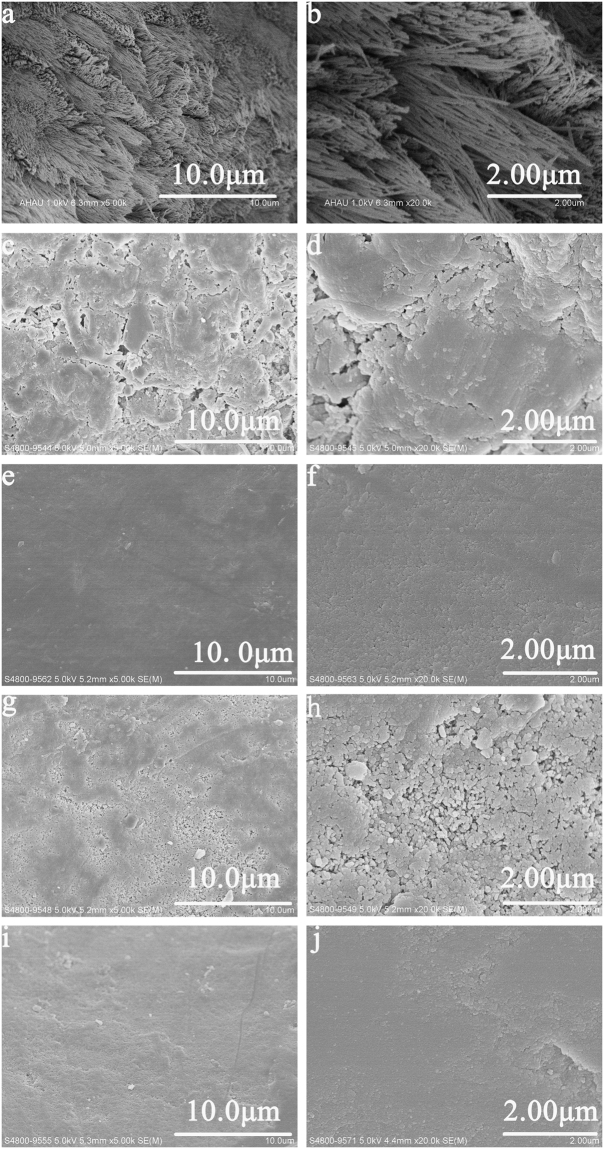
Figure 2.
SEM micrographs of acid-etched and remineralised enamel in vivo study. (a) Acid-etched enamel in blank control group. (b) The magnified micrograph of (a). (c) Remineralised enamel after 3 h remineralisation in group A. (d) The magnified micrograph of (c). (e) emineralised enamel after 5 h remineralisation in group A. (f) The magnified micrograph of (e). (g) Remineralised enamel after 3 h remineralisation in group B. (h) The magnified micrograph of (g). (i) Remineralised enamel after 5 h remineralisation in group B. (j) The magnified micrograph of (i).

