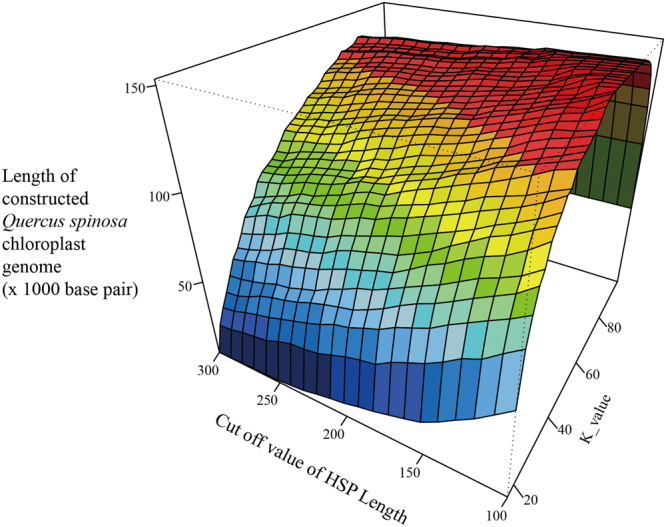
Figure 4.

The curve surface of lengths of the constructed Q. spinosa cp genome with different k-values of the k-mers used in the assembly step, odd numbers from 17 to 99, and different cutoff values of HSP lengths used in the similarity search step. The blue, green, yellow and red colors represent k-values as 17–39, 41–59, 61–79 and 81–99, respectively. The HSP lengths were from 100 to 300 in multiples of 10. The important affecter is the k-value of the k-mer used in the assembly step.
